Daniocell
fcho2 (epidermis)
FCH and mu domain containing endocytic adaptor 2
ZFIN
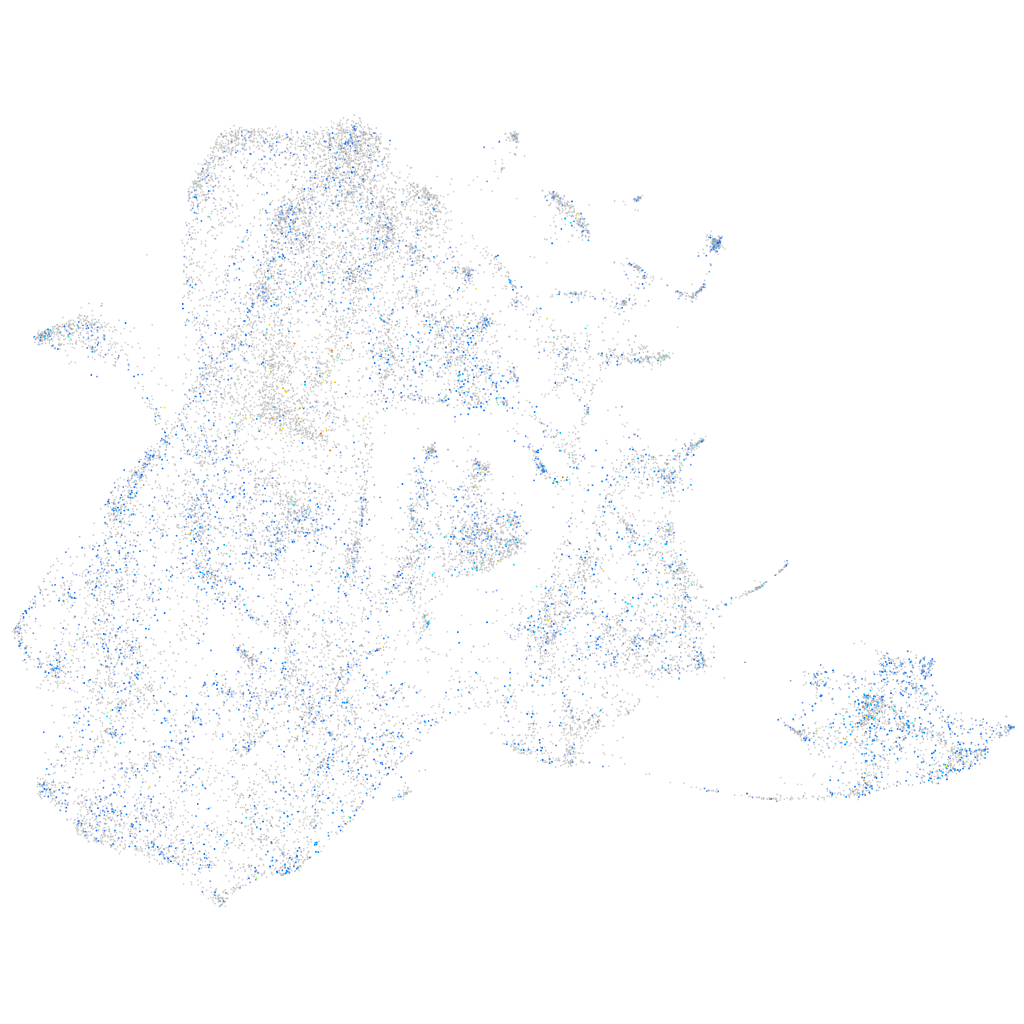
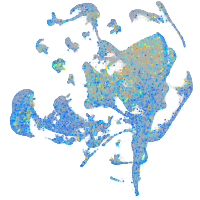
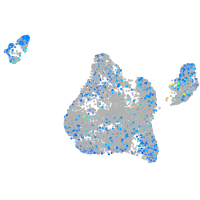
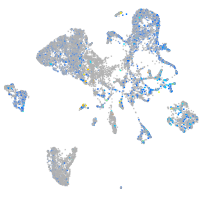
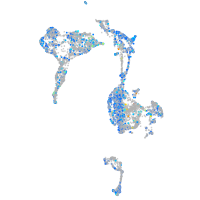
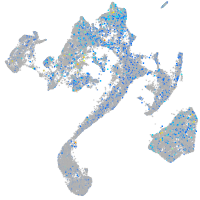
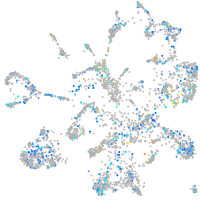
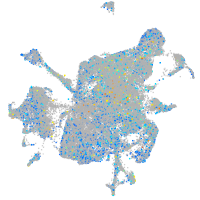
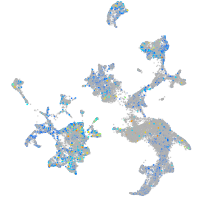
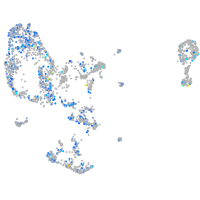
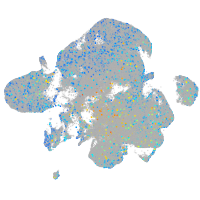
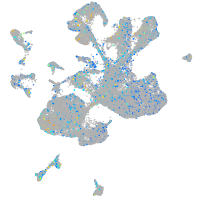
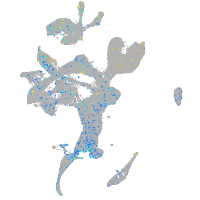
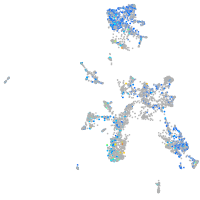
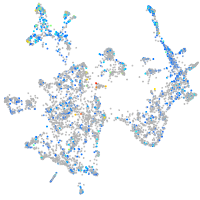
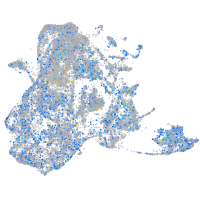
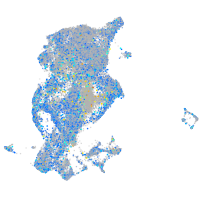
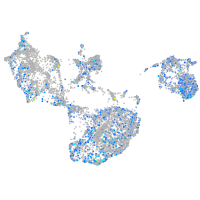
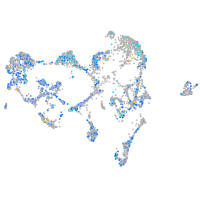
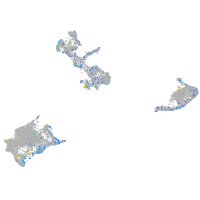
Gene expression UMAP
Display:
Expression
Stage
Other cell groups
all cells
blastomeres
PGCs
endoderm
axial mesoderm
muscle
mural cells /
non-skeletal muscle
mesenchyme
hematopoietic /
vasculature
pronephros
neural
spinal cord / glia
eye
taste / olfactory
otic / lateral line
epidermis
periderm
fin
ionocytes / mucous
pigment cells
Expression by stage/cluster
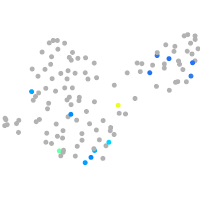
Correlated gene expression
Positive correlation
Negative correlation
Gene
r
Gene
r
mt-cyb
0.114
zgc:136930
-0.082
ppl
0.111
si:dkey-183i3.5
-0.079
si:ch73-204p21.2
0.110
si:dkey-151g10.6
-0.075
si:cabz01007794.1
0.110
rpl29
-0.071
evplb
0.108
rpl39
-0.070
si:ch211-157c3.4
0.105
rpl37
-0.070
evpla
0.105
si:dkey-33c14.3
-0.068
scel
0.103
rpl38
-0.065
stx11b.1
0.103
rbp4
-0.065
flot2b
0.102
lgals1l1
-0.060
erbb3a
0.102
wu:fa03e10
-0.060
lye
0.101
rps29
-0.059
stard14
0.101
krt91
-0.059
anxa1c
0.101
krtt1c19e
-0.058
si:ch73-347e22.8
0.101
zgc:77439
-0.058
si:ch211-125o16.4
0.100
krt5
-0.057
zgc:153665
0.100
col17a1a
-0.054
nqo1
0.099
rplp1
-0.053
anxa1b
0.099
cxl34b.11
-0.052
cdh1
0.099
npm1a
-0.050
zgc:100868
0.099
rsl1d1
-0.049
tmem45b
0.098
tsr2
-0.049
cldn23a
0.098
eevs
-0.049
si:ch211-217k17.9
0.098
si:dkey-239h2.3
-0.048
eppk1
0.098
rps24
-0.048
agr1
0.098
ptgdsb.1
-0.047
si:ch211-195b11.3
0.097
CU693494.2
-0.047
mt-atp6
0.097
stmn1a
-0.046
cldne
0.096
si:ch211-217k17.7
-0.046
selenow2b
0.095
cfd
-0.046
gbgt1l4
0.095
cckb
-0.045
krt1-19d
0.094
tmsb4x
-0.045
zgc:165423
0.094
rpl27a
-0.045
si:dkey-19b23.12
0.094
bccip
-0.045
prss60.2
0.094
sparc
-0.045