Daniocell
fabp6 (hematopoietic / vasculature)
"fatty acid binding protein 6, ileal (gastrotropin)"
ZFIN
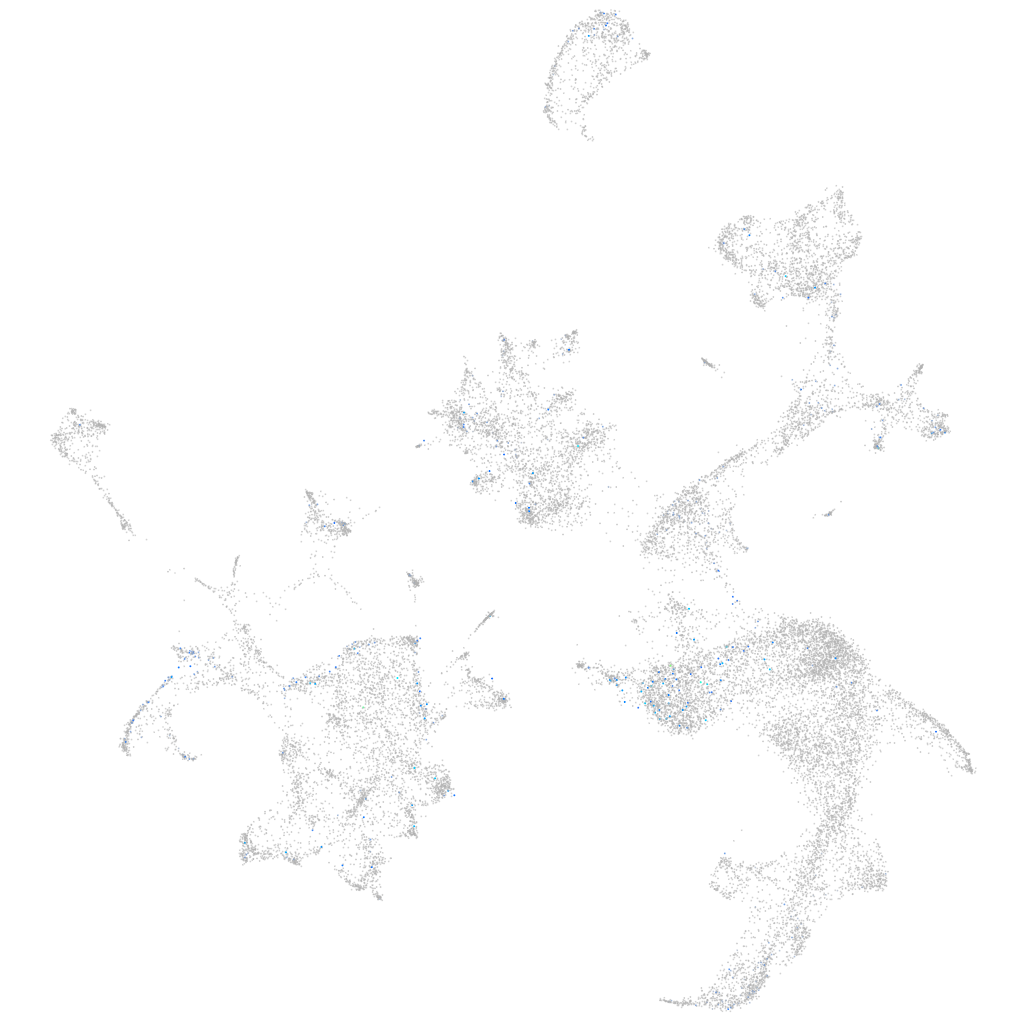
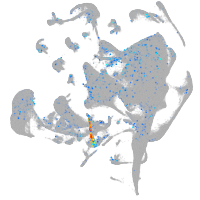
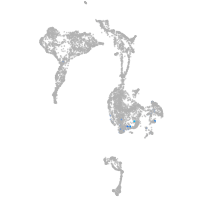
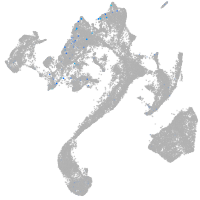
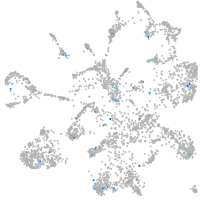
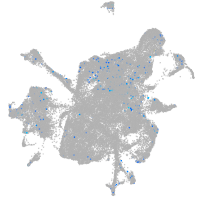
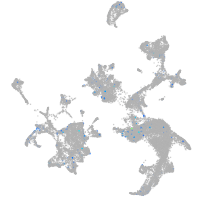
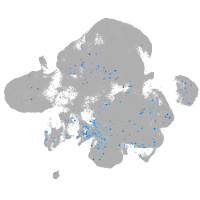
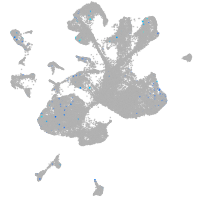
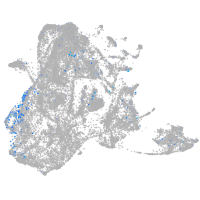
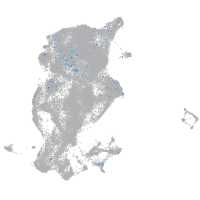
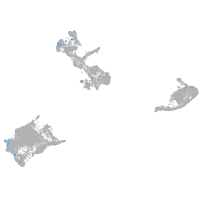
Gene expression UMAP
Display:
Expression
Stage
Other cell groups
all cells
blastomeres
PGCs
endoderm
axial mesoderm
muscle
mural cells /
non-skeletal muscle
mesenchyme
hematopoietic /
vasculature
pronephros
neural
spinal cord / glia
eye
taste / olfactory
otic / lateral line
epidermis
periderm
fin
ionocytes / mucous
pigment cells
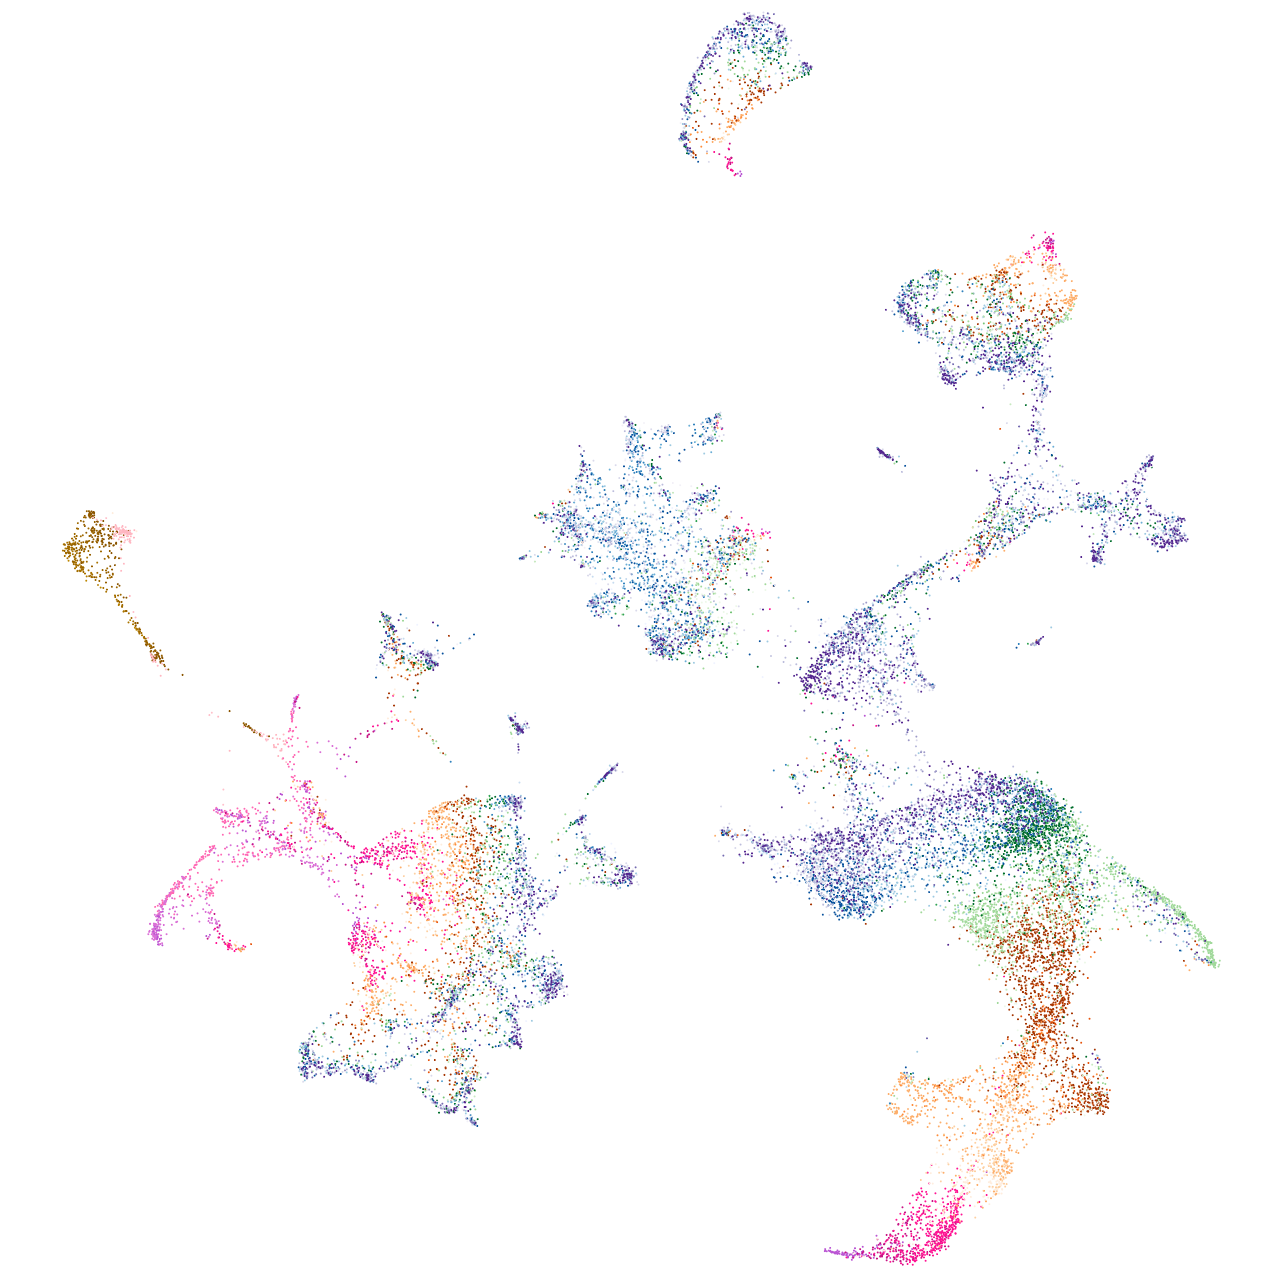
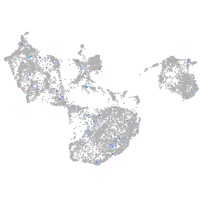
Expression by stage/cluster
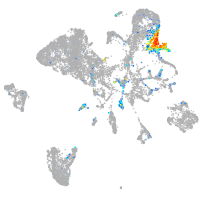
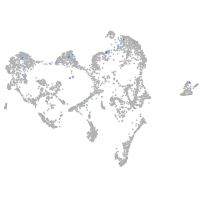
Correlated gene expression
Positive correlation
Negative correlation
Gene
r
Gene
r
si:dkey-250k15.7
0.109
hbbe3
-0.032
CELA1 (1 of many)
0.100
pabpc1a
-0.027
LOC108180102
0.093
rps18
-0.024
LOC110439567
0.093
metap2b
-0.024
XLOC-020101
0.085
seta
-0.022
mnx1
0.085
rpl18a
-0.022
CU062487.1
0.084
uba52
-0.021
si:dkey-33c12.12
0.081
rps6
-0.020
si:dkey-58b18.8
0.080
mthfd2
-0.020
s100a10a
0.079
pabpc1b
-0.020
epdl2
0.078
hnrnpa1a
-0.020
apoa1b
0.078
ndrg1a
-0.020
CR788303.1
0.078
slc4a1a
-0.020
lgals2b
0.076
rhd
-0.019
LOC103908925
0.076
hbae1.3
-0.019
ctrb1
0.076
parvb
-0.019
si:ch73-194c23.1
0.075
gtpbp1
-0.019
prss1
0.074
anxa11a
-0.018
XLOC-033023
0.073
tubb1
-0.018
prss59.2
0.073
si:ch211-113a14.18
-0.018
apoa2
0.073
ccdc32
-0.018
cpb1
0.071
cbr1l
-0.018
rxfp2l
0.071
si:ch73-250a16.5
-0.018
si:ch73-173p19.2
0.070
atf5a
-0.017
dhrs7ca
0.068
alas2
-0.017
si:dkey-30c15.13
0.068
mccc2
-0.017
bcdin3d
0.067
marcksa
-0.017
actc1b
0.066
shmt2
-0.017
prss59.1
0.065
atp5md
-0.017
ela2
0.065
nprl3
-0.017
zgc:92040
0.065
zgc:158564
-0.017
si:dkey-11o15.7
0.065
lmf2b
-0.017
pvalb2
0.065
eif4ebp2
-0.017
baiap2l2a
0.064
paox1
-0.017
pvalb1
0.064
myo9ab
-0.017