Daniocell
epb41l5 (fin)
erythrocyte membrane protein band 4.1 like 5
ZFIN
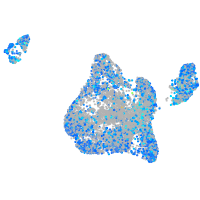
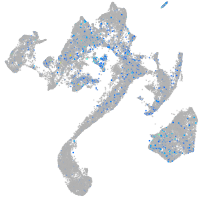
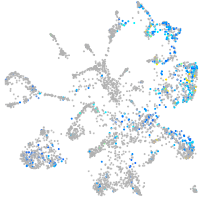
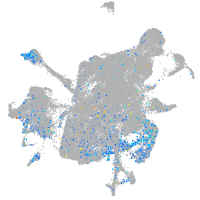
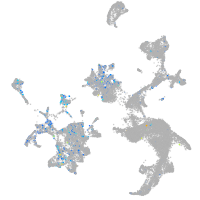
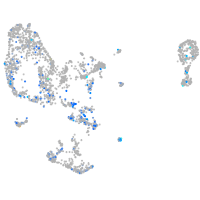
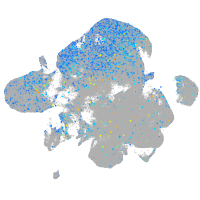
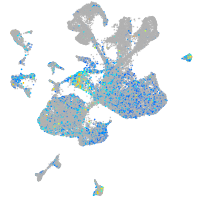
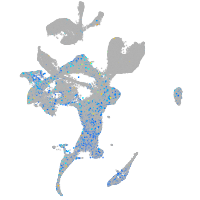
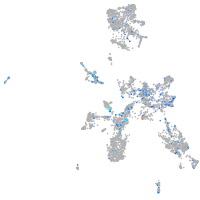
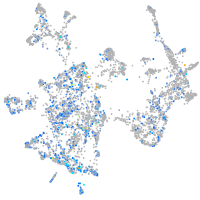
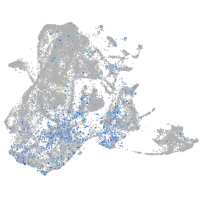
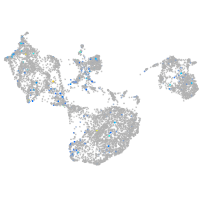
Gene expression UMAP
Display:
Expression
Stage
Other cell groups
all cells
blastomeres
PGCs
endoderm
axial mesoderm
muscle
mural cells /
non-skeletal muscle
mesenchyme
hematopoietic /
vasculature
pronephros
neural
spinal cord / glia
eye
taste / olfactory
otic / lateral line
epidermis
periderm
fin
ionocytes / mucous
pigment cells
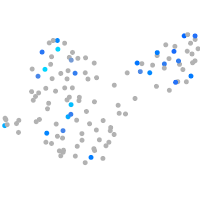
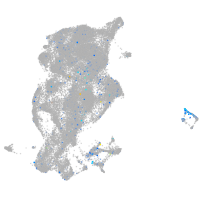
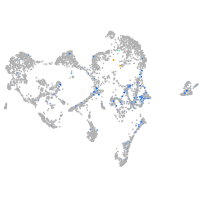
Expression by stage/cluster
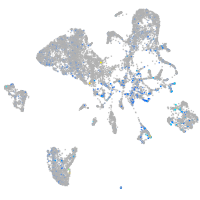
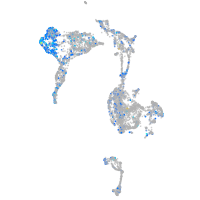
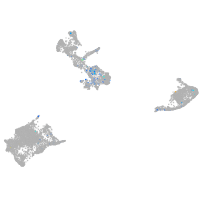
Correlated gene expression
Positive correlation
Negative correlation
Gene
r
Gene
r
si:ch211-163l21.10
0.196
wu:fb18f06
-0.071
cbln9
0.175
rbp4
-0.070
BX323854.1
0.173
krt4
-0.066
fmn1
0.163
cyt1
-0.065
LOC101883398
0.161
anxa1a
-0.064
BX927323.1
0.157
si:ch211-105c13.3
-0.063
LOC101883314
0.154
capgb
-0.062
CU855758.1
0.150
tmsb1
-0.061
gpr55a
0.141
si:dkey-33c14.3
-0.060
LOC572443
0.140
krt5
-0.060
CR762480.2
0.136
cfl1l
-0.059
opn4a
0.132
s100a10b
-0.058
si:ch211-130m23.3
0.123
pfn1
-0.058
XLOC-011673
0.121
hcls1
-0.058
si:dkeyp-72e1.7
0.121
zgc:153284
-0.057
LOC110437760
0.120
ecrg4b
-0.057
CU207281.2
0.120
myh9a
-0.057
pkn1b
0.120
si:rp71-77l1.1
-0.056
XLOC-018363
0.118
epcam
-0.056
si:ch1073-464p5.5
0.118
cldn1
-0.055
XLOC-008391
0.117
pnp5a
-0.054
pdp2
0.116
wu:fa03e10
-0.053
XLOC-003052
0.116
cotl1
-0.053
il2rb
0.113
si:ch1073-406l10.2
-0.052
LOC101882159
0.112
pkp3a
-0.052
LOC101882795
0.112
epgn
-0.052
tubgcp2
0.111
itm2bb
-0.052
LOC110437749
0.111
itgb4
-0.052
CU655820.1
0.110
col14a1b
-0.051
st6galnac1.1
0.109
thy1
-0.051
calca
0.109
si:dkey-248g15.3
-0.051
si:dkey-165n16.5
0.108
anxa2a
-0.051
msi1
0.108
cldni
-0.050
elob
0.107
ahnak
-0.050
LOC110438754
0.106
cast
-0.050