Daniocell
elmo3 (blastomeres)
engulfment and cell motility 3
ZFIN
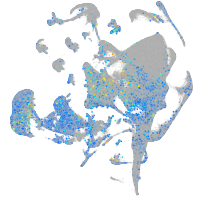
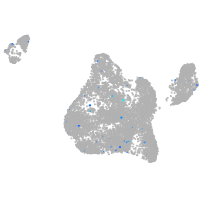
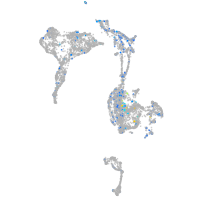
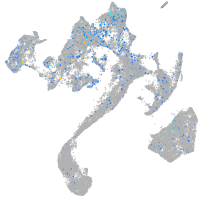
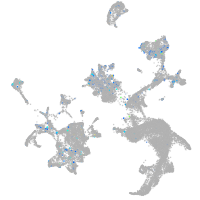
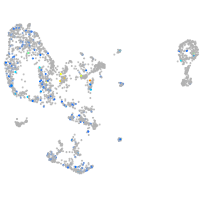
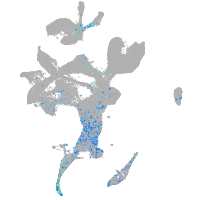
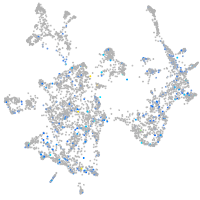
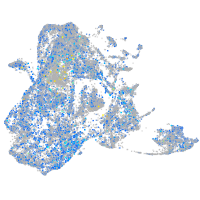
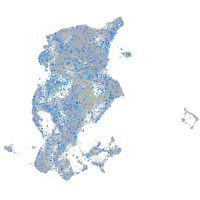
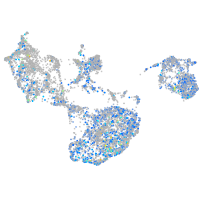
Gene expression UMAP
Display:
Expression
Stage
Other cell groups
all cells
blastomeres
PGCs
endoderm
axial mesoderm
muscle
mural cells /
non-skeletal muscle
mesenchyme
hematopoietic /
vasculature
pronephros
neural
spinal cord / glia
eye
taste / olfactory
otic / lateral line
epidermis
periderm
fin
ionocytes / mucous
pigment cells
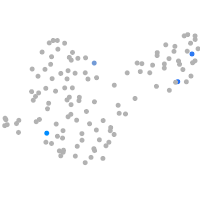
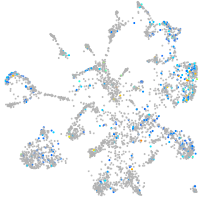
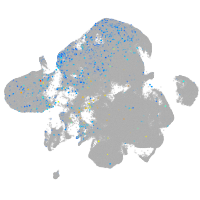
Expression by stage/cluster
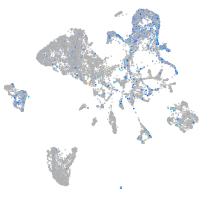
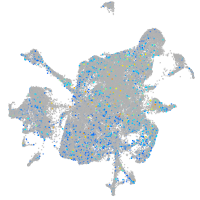
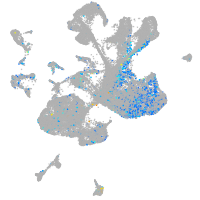
Correlated gene expression
Positive correlation
Negative correlation
Gene
r
Gene
r
CR762407.2
0.167
rps16
-0.033
fkbp1b
0.159
ddx39ab
-0.032
adamts15a
0.153
aldob
-0.032
BX072559.1
0.151
cirbpb
-0.031
BX571952.1
0.149
si:ch211-152c2.3
-0.030
BX571712.3
0.125
si:dkey-188h10.3
-0.029
hcrtr2
0.124
nudt21
-0.029
sptssb
0.122
rbm8a
-0.029
BX005402.1
0.119
stm
-0.029
pcdh2ab9
0.119
si:dkey-228b2.6
-0.028
zgc:123217
0.114
zbed4
-0.028
tuba7l
0.113
psma3
-0.028
CT030153.1
0.106
cx43.4
-0.028
cdhr1a
0.106
hdac1
-0.027
LOC103911819
0.106
psmb7
-0.027
CR318614.1
0.104
tubb2b
-0.027
CU466285.1
0.104
hspb1
-0.027
LOC110439462
0.103
hif1al
-0.026
LOC101882525
0.102
hmgn7
-0.026
fgg
0.102
rac2
-0.026
hoxb8a
0.101
srsf3b
-0.026
prrt2
0.099
srsf7a
-0.026
slc1a7b
0.099
ddx39b
-0.025
rom1a
0.097
ilf2
-0.025
spon2b
0.096
hnrnpabb
-0.025
CR376776.1
0.093
rasl11b
-0.024
frmpd1
0.091
stk16
-0.024
efcab6
0.089
rps11
-0.024
si:dkey-103g5.3
0.087
ckbb
-0.024
nrtn
0.085
rps29
-0.024
zgc:171558
0.085
psmb4
-0.024
si:dkey-179k24.5
0.085
tbx16
-0.024
si:dkey-182i3.11
0.085
si:ch211-261n11.5
-0.024
LOC108190593
0.084
rps15
-0.024
psmb11b
0.083
marcksl1b
-0.024