
"eukaryotic translation initiation factor 4 gamma, 3a"
ZFIN 
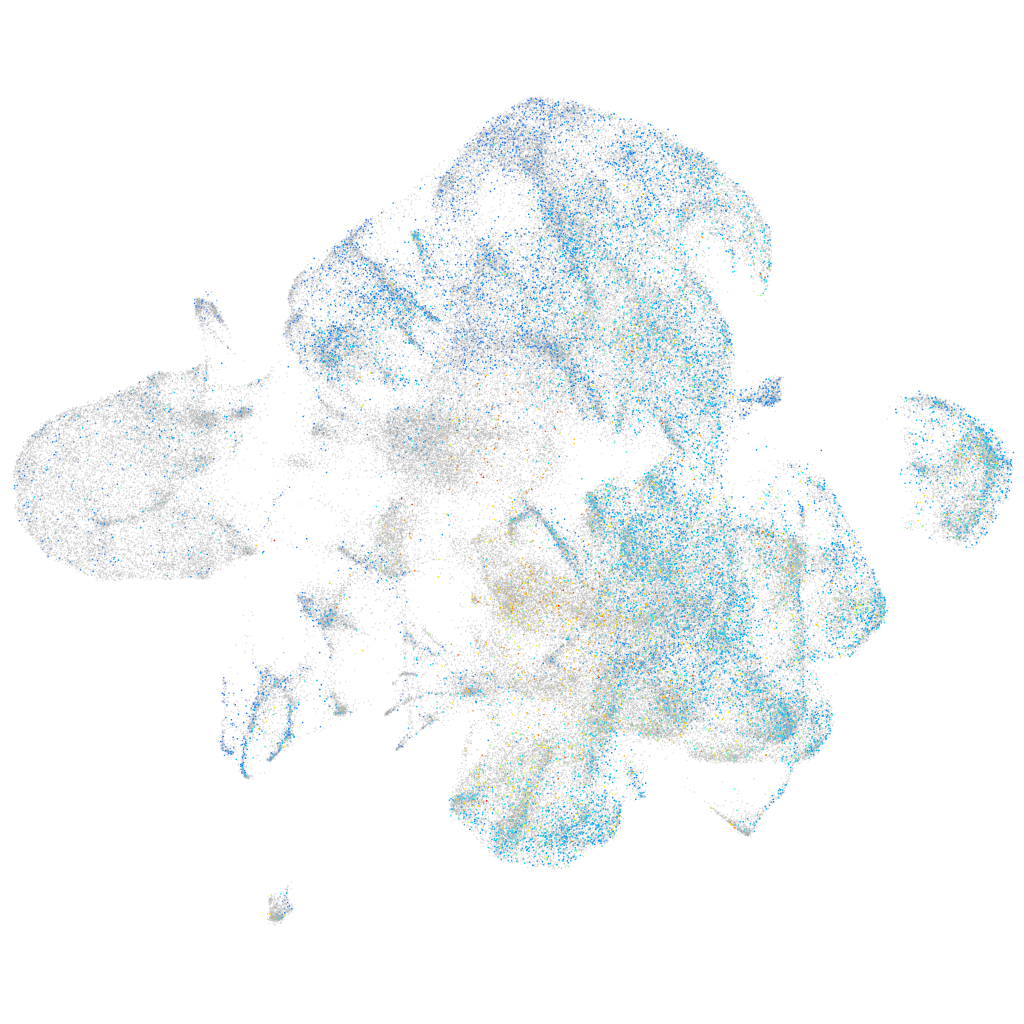
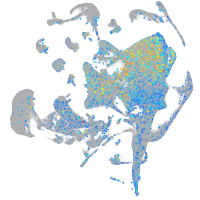
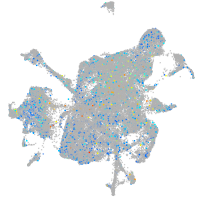
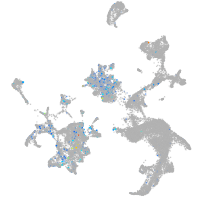
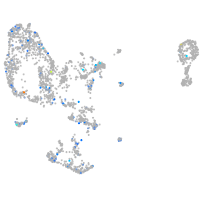
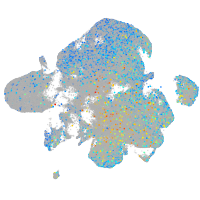
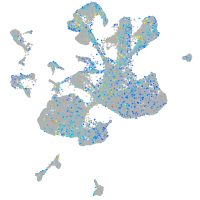
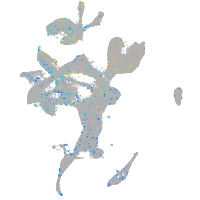
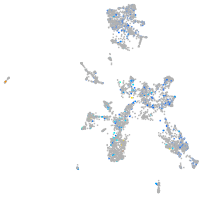
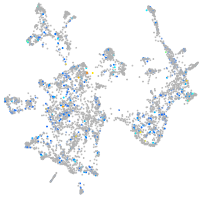
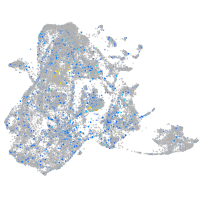
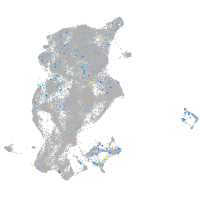
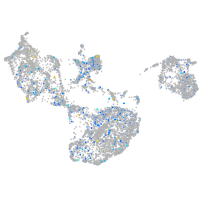
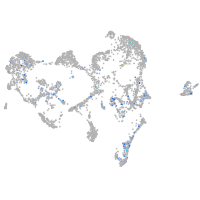
Gene expression UMAP


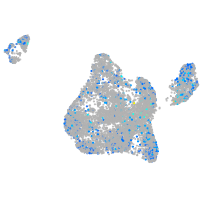
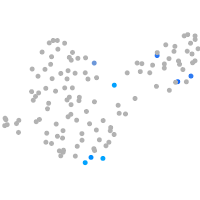
Expression by stage/cluster
Correlated gene expression
| Positive correlation | Negative correlation | ||
| Gene | r | Gene | r |
| elavl3 | 0.124 | npm1a | -0.100 |
| nova2 | 0.123 | dkc1 | -0.092 |
| tuba1c | 0.117 | hmgb2a | -0.090 |
| tubb5 | 0.114 | nop58 | -0.089 |
| hmgb3a | 0.108 | snu13b | -0.087 |
| rtn1a | 0.104 | pcna | -0.086 |
| tmeff1b | 0.104 | fbl | -0.086 |
| dpysl2b | 0.103 | hspb1 | -0.085 |
| tuba1a | 0.102 | nop56 | -0.084 |
| ywhah | 0.101 | rsl1d1 | -0.084 |
| tmsb | 0.099 | nop10 | -0.082 |
| ptmaa | 0.097 | aldob | -0.081 |
| stmn1b | 0.096 | nop2 | -0.079 |
| dpysl3 | 0.095 | anp32b | -0.079 |
| myt1b | 0.095 | nhp2 | -0.076 |
| ckbb | 0.093 | si:ch211-152c2.3 | -0.075 |
| CR383676.1 | 0.092 | mcm6 | -0.075 |
| gng2 | 0.092 | nasp | -0.073 |
| celf2 | 0.091 | apoeb | -0.073 |
| zfhx3 | 0.091 | banf1 | -0.073 |
| gpm6aa | 0.091 | selenoh | -0.072 |
| fam168a | 0.090 | gar1 | -0.072 |
| elavl4 | 0.089 | mcm3 | -0.072 |
| myt1a | 0.089 | lig1 | -0.072 |
| gng3 | 0.088 | gnl3 | -0.071 |
| cd99l2 | 0.087 | ddx18 | -0.071 |
| jpt1b | 0.086 | fen1 | -0.071 |
| fez1 | 0.086 | stmn1a | -0.070 |
| dbn1 | 0.086 | cdca7a | -0.070 |
| celf3a | 0.085 | ncl | -0.069 |
| kdm6bb | 0.085 | eif4ebp3l | -0.069 |
| oaz1b | 0.083 | apoc1 | -0.068 |
| rtn1b | 0.083 | ranbp1 | -0.068 |
| zc4h2 | 0.083 | chaf1a | -0.068 |
| chd4a | 0.083 | ebna1bp2 | -0.067 |