Daniocell
egln3 (pigment cells)
egl-9 family hypoxia-inducible factor 3
ZFIN
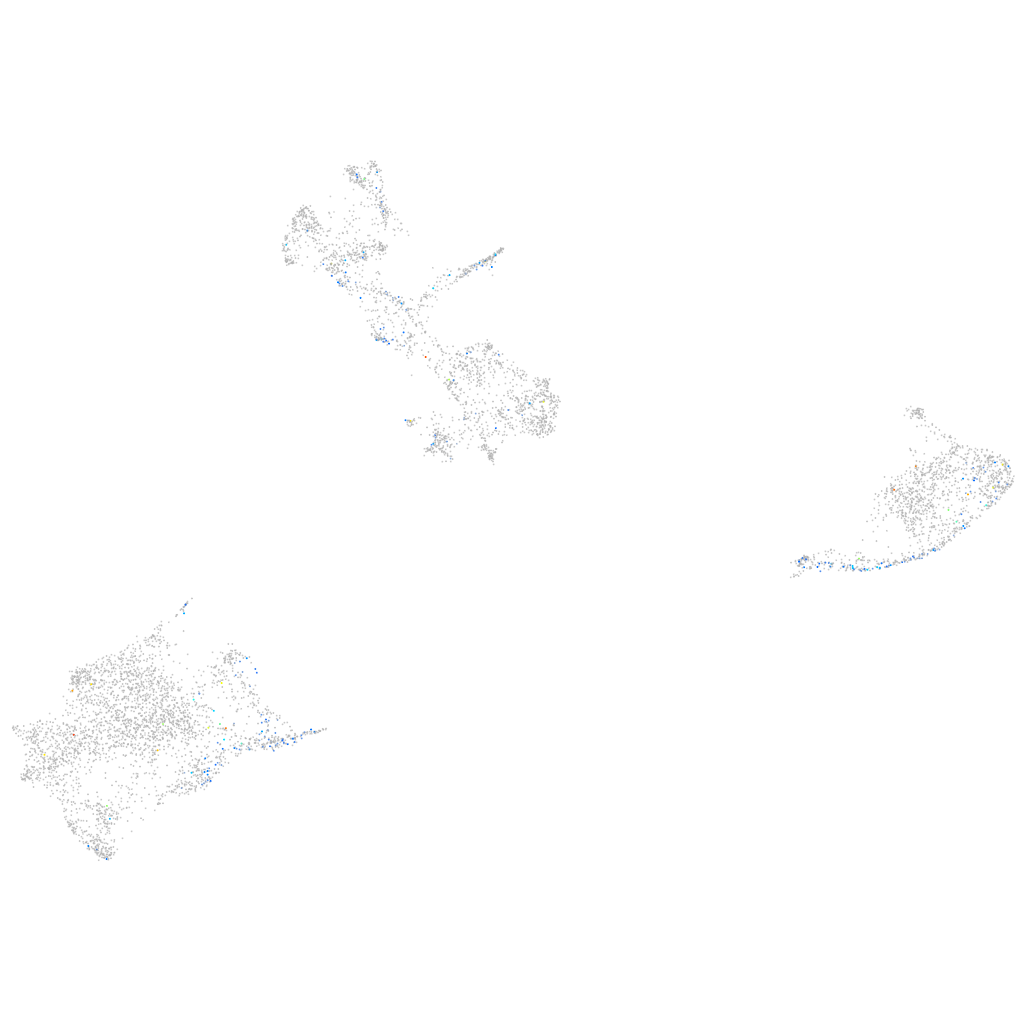
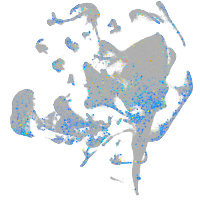
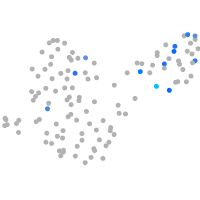
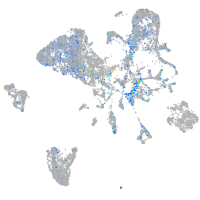
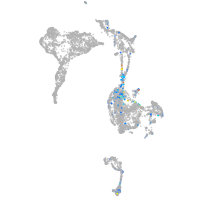
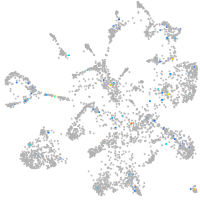
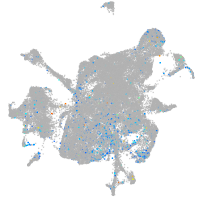
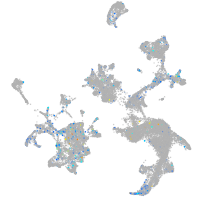
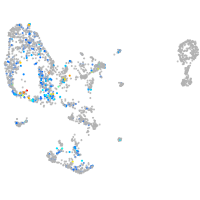
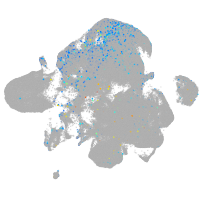
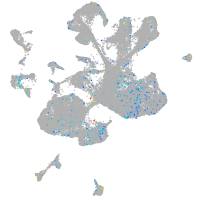
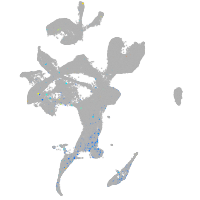
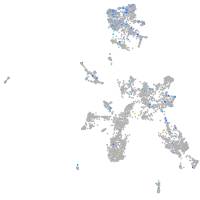
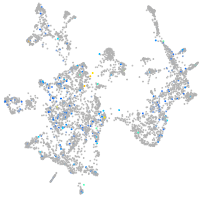
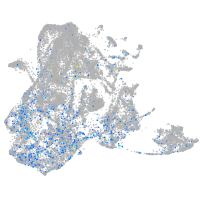
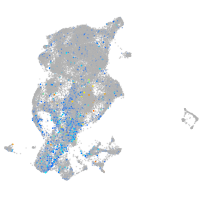
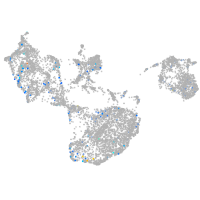
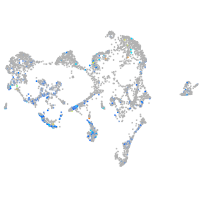
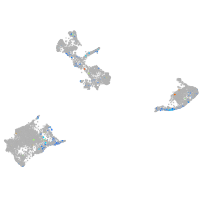
Gene expression UMAP
Display:
Expression
Stage
Other cell groups
all cells
blastomeres
PGCs
endoderm
axial mesoderm
muscle
mural cells /
non-skeletal muscle
mesenchyme
hematopoietic /
vasculature
pronephros
neural
spinal cord / glia
eye
taste / olfactory
otic / lateral line
epidermis
periderm
fin
ionocytes / mucous
pigment cells
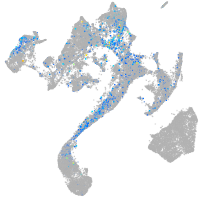
Expression by stage/cluster
Correlated gene expression
Positive correlation
Negative correlation
Gene
r
Gene
r
fhdc5
0.185
pvalb2
-0.075
LOC101884613
0.172
pvalb1
-0.067
si:ch211-207e19.15
0.153
actc1b
-0.057
LOC101887106
0.141
si:dkey-251i10.2
-0.053
CR848715.1
0.138
mylz3
-0.051
LOC110440053
0.131
zgc:110339
-0.050
si:dkey-85k7.7
0.128
uraha
-0.046
six9
0.128
zgc:153031
-0.041
hcn3
0.124
myl1
-0.041
LOC101882916
0.123
nme2b.2
-0.040
cnga1a
0.123
gstp1
-0.038
cldn20
0.122
ptmaa
-0.038
lpar3
0.122
nova2
-0.037
CU856622.1
0.121
CABZ01021592.1
-0.037
uts2a
0.120
tnni2a.4
-0.037
LOC110437964
0.120
mdh1aa
-0.037
LOC103912045
0.115
hbbe1.3
-0.037
AL928824.1
0.113
mylpfa
-0.037
kdf1b
0.111
fabp7a
-0.036
map1lc3cl
0.111
apoa1b
-0.035
si:dkey-96l17.6
0.111
ndrg2
-0.035
si:ch73-368j24.3
0.109
aqp3a
-0.035
RF00213
0.108
prss1
-0.034
LOC108179174
0.101
si:ch211-251b21.1
-0.033
si:ch211-202c21.7
0.101
tnnc2
-0.033
adra1ba
0.100
ckmb
-0.033
prkg1b
0.100
mylpfb
-0.033
CABZ01086734.1
0.100
stmn1b
-0.033
fgf17
0.098
tnnt3b
-0.033
CT955963.1
0.097
slc22a7a
-0.032
p4ha1b
0.097
bscl2l
-0.032
def6a
0.095
si:dkeyp-75h12.5
-0.031
grin3bb
0.093
prdx5
-0.031
sox10
0.092
calm1b
-0.031
LOC100537633
0.092
pleca
-0.031