Daniocell
efcab11 (pigment cells)
EF-hand calcium binding domain 11
ZFIN
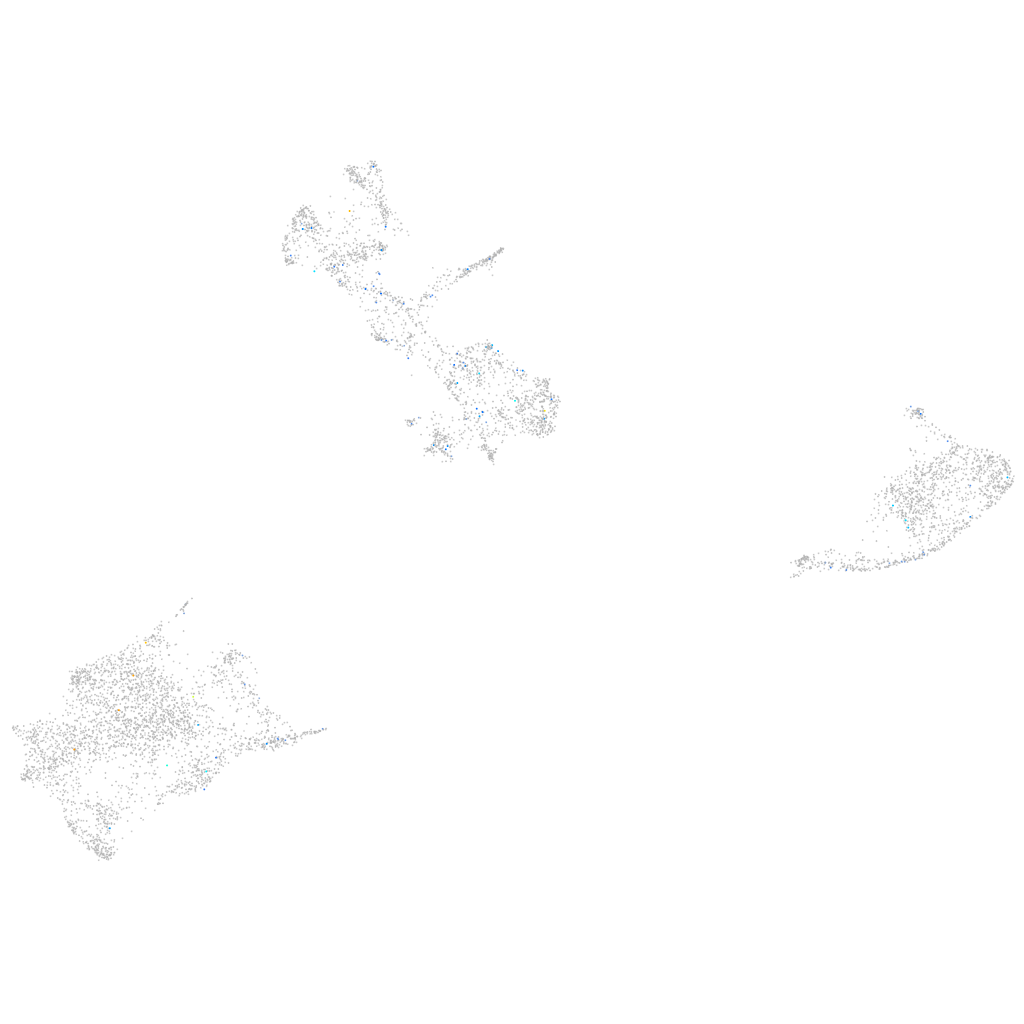
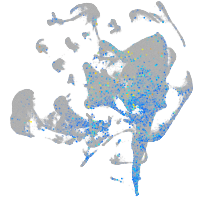
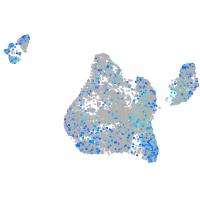
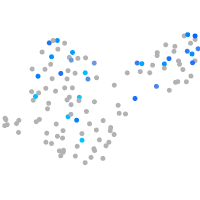
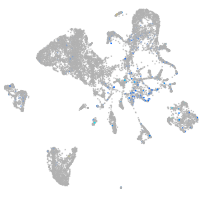
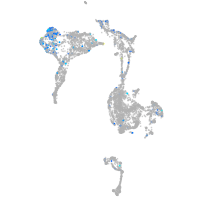
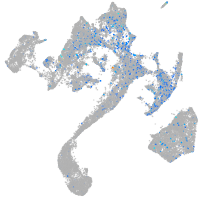
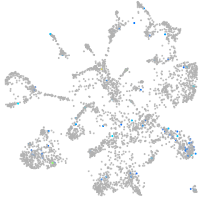
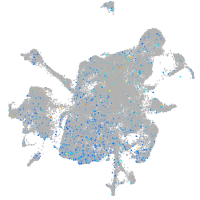
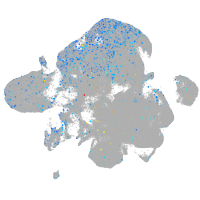
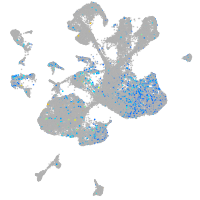
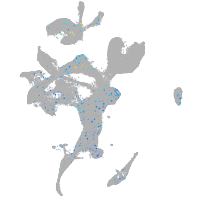
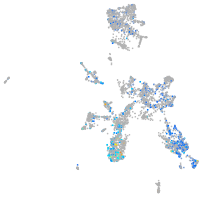
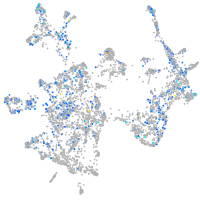
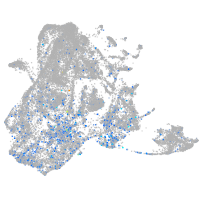
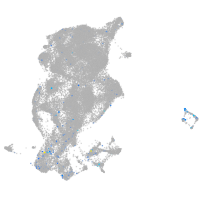
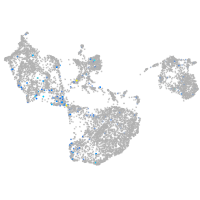
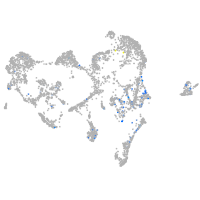
Gene expression UMAP
Display:
Expression
Stage
Other cell groups
all cells
blastomeres
PGCs
endoderm
axial mesoderm
muscle
mural cells /
non-skeletal muscle
mesenchyme
hematopoietic /
vasculature
pronephros
neural
spinal cord / glia
eye
taste / olfactory
otic / lateral line
epidermis
periderm
fin
ionocytes / mucous
pigment cells
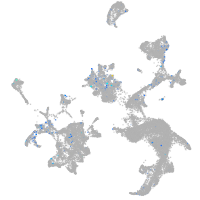
Expression by stage/cluster
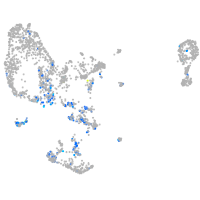
Correlated gene expression
Positive correlation
Negative correlation
Gene
r
Gene
r
arfip2b
0.220
uraha
-0.040
tmem72
0.219
zgc:110339
-0.038
si:ch211-215j19.12
0.166
gstp1
-0.036
iqcg
0.159
csrp2
-0.032
XLOC-002305
0.156
slc22a7a
-0.032
si:dkey-222b8.4
0.154
hbae1.1
-0.031
LOC100537389
0.147
gch2
-0.030
or125-6
0.145
aqp3a
-0.028
BX927275.2
0.141
hbbe1.2
-0.027
cfap43
0.139
vat1
-0.027
LOC100536937
0.138
icn
-0.026
sim1a
0.138
CABZ01021592.1
-0.026
kif9
0.125
dio3a
-0.026
gzm3.2
0.124
si:dkey-251i10.2
-0.026
BX511021.1
0.122
oaz2a
-0.025
zgc:112183
0.120
zgc:113337
-0.025
rsph9
0.119
s100a10b
-0.025
zgc:152753
0.116
opn4xb
-0.025
si:ch211-229d2.5
0.115
pabpc1b
-0.024
LOC103909982
0.115
si:zfos-1069f5.1
-0.024
zgc:100951
0.114
cyb5a
-0.024
parapinopsinb
0.110
cdo1
-0.024
LOC110438344
0.110
opn5
-0.024
LOC103911188
0.110
slc38a5b
-0.024
LOC100149991
0.110
pvalb2
-0.024
calhm2
0.105
sesn1
-0.024
hcn1
0.104
aox5
-0.023
bzw2
0.102
agmo
-0.023
wdr78
0.101
tpma
-0.023
LOC101885363
0.101
myhz2
-0.023
angpt4
0.100
rab20
-0.022
CR855277.2
0.098
nfe2l2a
-0.022
b3gnt5b
0.098
stom
-0.022
BX908753.1
0.097
plekha5
-0.022
si:ch211-212k18.15
0.096
zgc:153184
-0.022