Daniocell
eevs (endoderm)
2-epi-5-epi-valiolone synthase
ZFIN
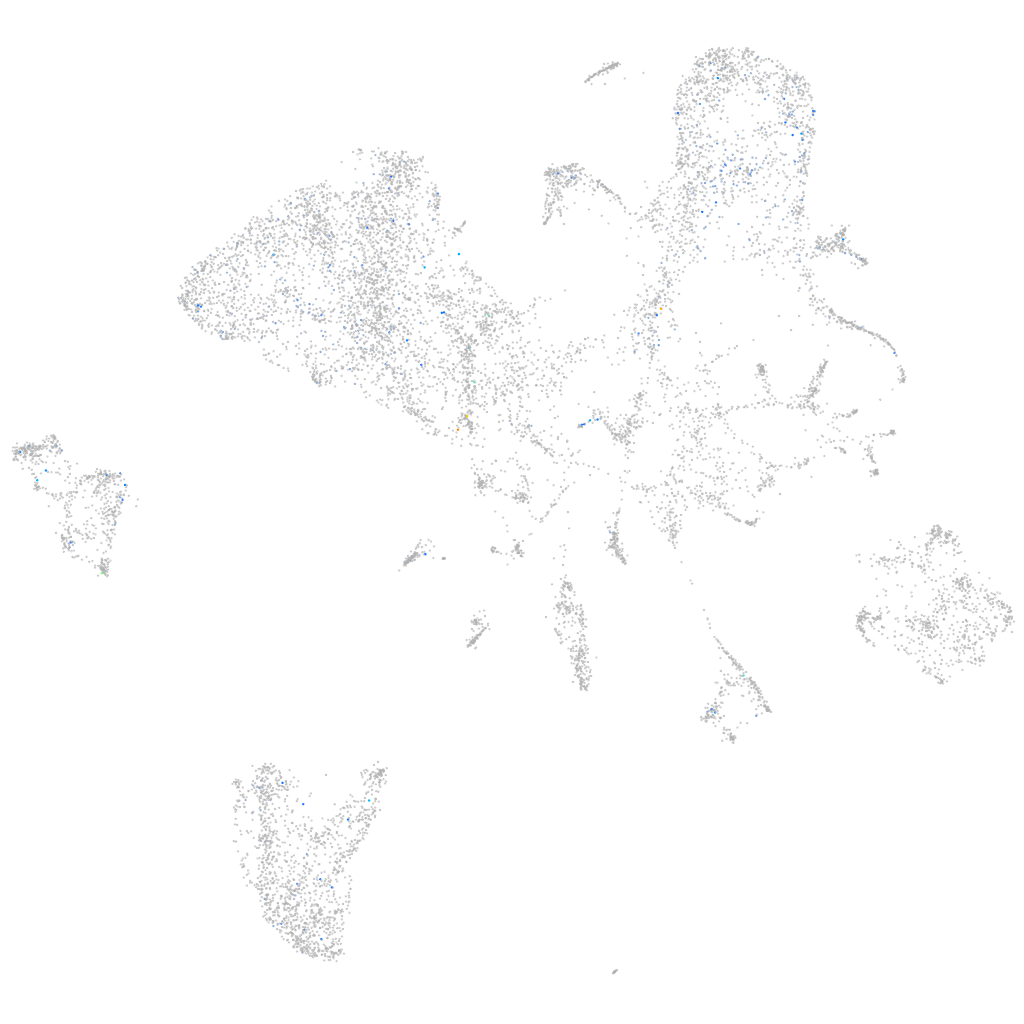
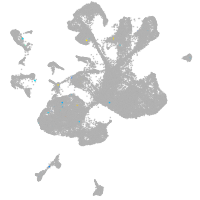
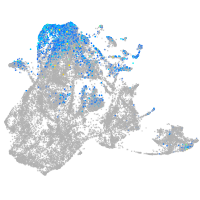
Gene expression UMAP
Display:
Expression
Stage
Other cell groups
all cells
blastomeres
PGCs
endoderm
axial mesoderm
muscle
mural cells /
non-skeletal muscle
mesenchyme
hematopoietic /
vasculature
pronephros
neural
spinal cord / glia
eye
taste / olfactory
otic / lateral line
epidermis
periderm
fin
ionocytes / mucous
pigment cells
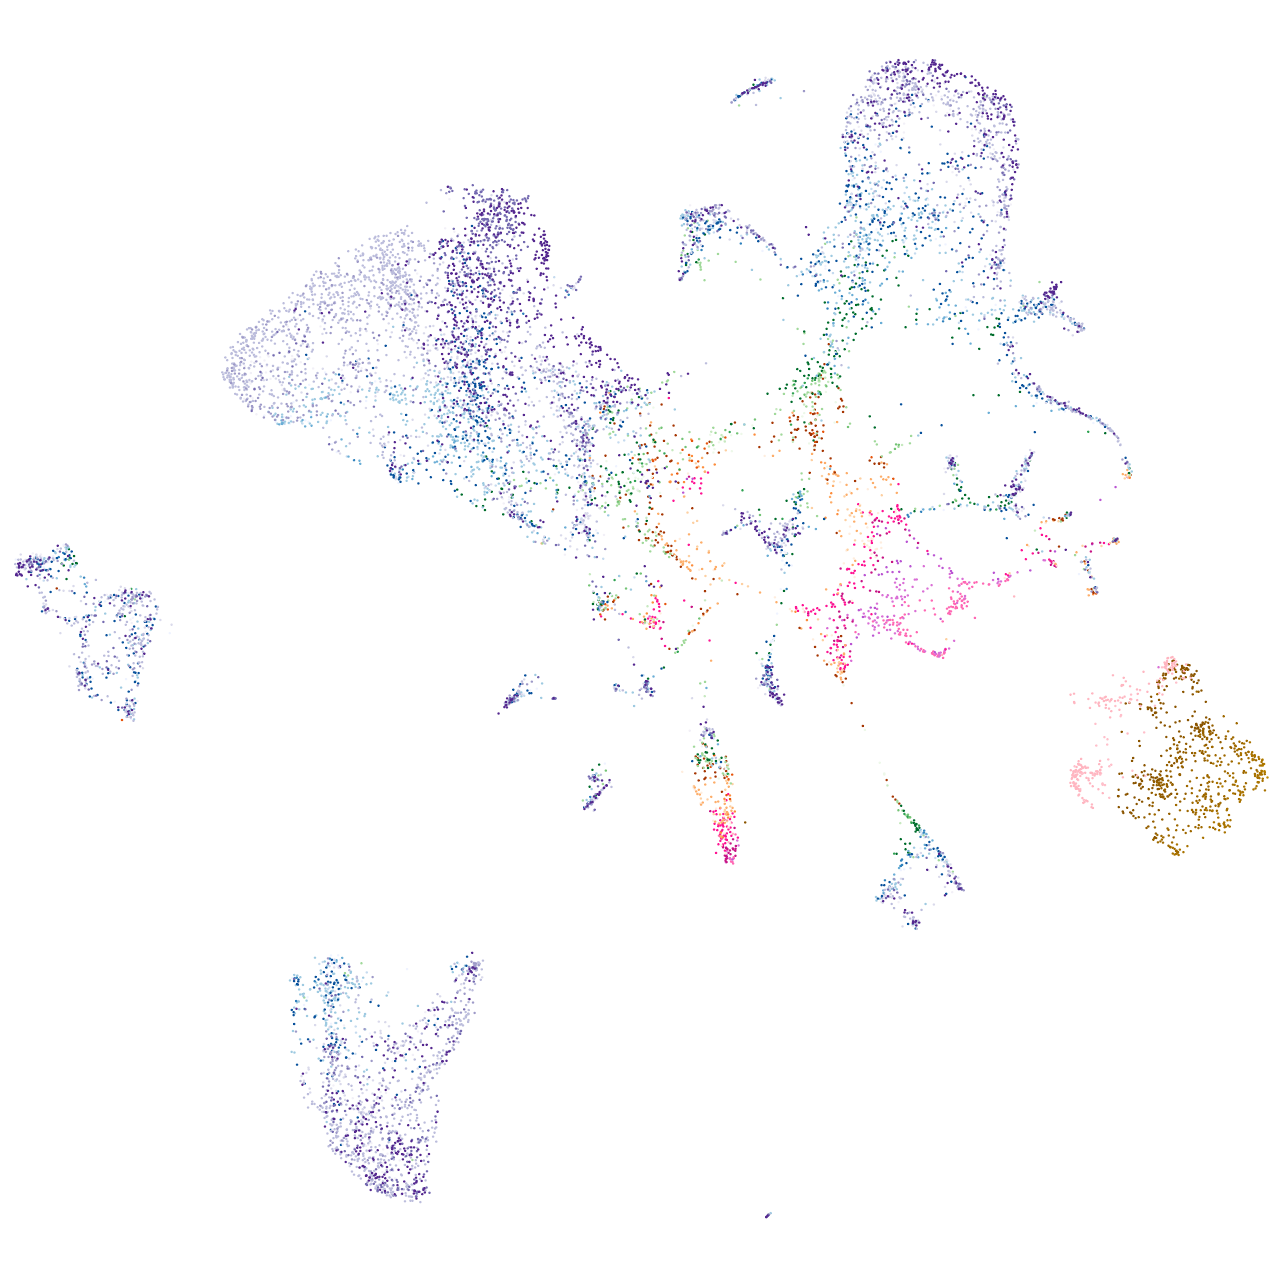
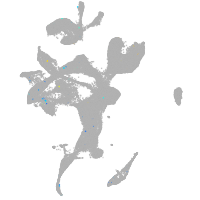
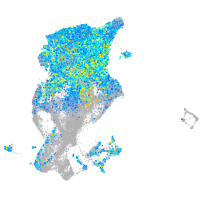
Expression by stage/cluster
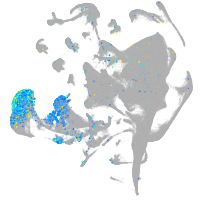
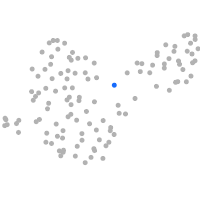
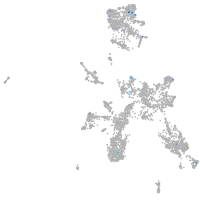
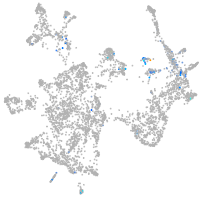
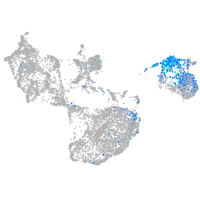
Correlated gene expression
Positive correlation
Negative correlation
Gene
r
Gene
r
urgcp
0.239
marcksb
-0.048
mir199-2
0.209
hmgb1b
-0.047
tbkbp1
0.207
hspb1
-0.045
gata1a
0.206
cx43.4
-0.045
tectb
0.189
marcksl1b
-0.042
CR388168.2
0.187
tspan7
-0.041
slitrk5a
0.184
hmgn6
-0.041
si:ch73-42k18.1
0.180
cdh6
-0.040
ankk1
0.169
hmgn7
-0.040
CR788316.4
0.165
id1
-0.040
cx28.6
0.157
tgif1
-0.039
hmx1
0.151
si:ch211-137a8.4
-0.039
igfbp5a
0.149
nucks1a
-0.039
trim101
0.149
cdh2
-0.038
pde6a
0.144
akap12b
-0.038
LOC110438242
0.140
si:ch211-152c2.3
-0.038
CU571315.2
0.139
hmgb3a
-0.038
XLOC-043124
0.138
qkia
-0.038
XLOC-025327
0.138
acin1a
-0.037
gas2l3
0.132
tmeff1b
-0.036
zgc:109965
0.127
sox11a
-0.036
si:dkey-85k7.11
0.118
id3
-0.035
CR847531.1
0.114
hnrnpa0a
-0.035
fam217b
0.114
dpf2l
-0.035
pax5
0.114
sept15
-0.035
popdc3
0.113
pbx4
-0.035
CR854927.3
0.110
apex1
-0.035
si:dkey-4p15.5
0.110
glulb
-0.034
si:ch211-160f23.7
0.109
sox11b
-0.034
XLOC-015286
0.109
smarcb1b
-0.034
zgc:111983
0.107
si:dkey-56m19.5
-0.034
tas1r2.1
0.107
fthl27
-0.034
phox2bb
0.105
akt1s1
-0.034
lgals1l1
0.105
si:ch73-1a9.3
-0.034
si:dkey-85k7.10
0.103
rsf1b.1
-0.034