Daniocell
eef1da (ionocytes / mucous-producing)
eukaryotic translation elongation factor 1 delta a (guanine nucleotide exchange protein)
ZFIN
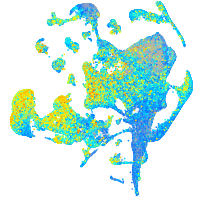
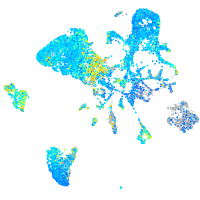
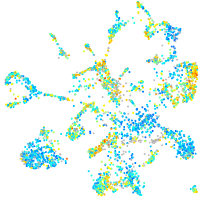
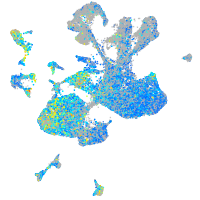
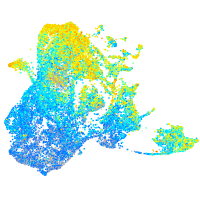
Gene expression UMAP
Display:
Expression
Stage
Other cell groups
all cells
blastomeres
PGCs
endoderm
axial mesoderm
muscle
mural cells /
non-skeletal muscle
mesenchyme
hematopoietic /
vasculature
pronephros
neural
spinal cord / glia
eye
taste / olfactory
otic / lateral line
epidermis
periderm
fin
ionocytes / mucous
pigment cells
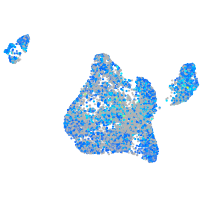
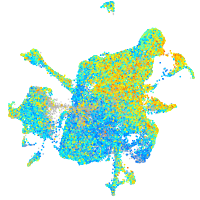
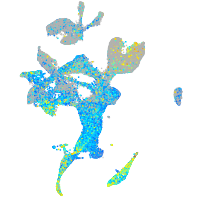
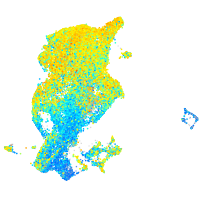
Expression by stage/cluster
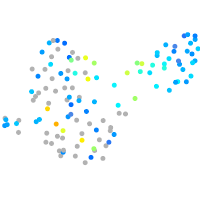
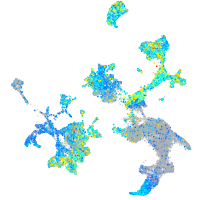
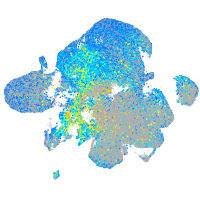
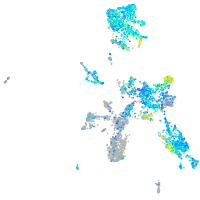
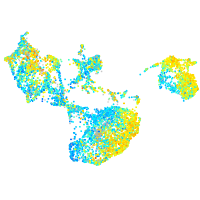
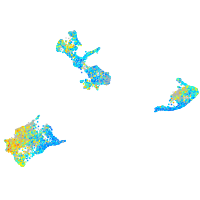
Correlated gene expression
Positive correlation
Negative correlation
Gene
r
Gene
r
tdh
0.402
hmga1a
-0.293
pycard
0.389
si:ch211-222l21.1
-0.291
si:ch211-207n23.2
0.389
ptmab
-0.276
scel
0.388
h2afvb
-0.269
abcb5
0.382
si:ch73-281n10.2
-0.247
wu:fa03e10
0.380
cx43.4
-0.243
nme2b.1
0.374
hmgn2
-0.237
mcl1a
0.374
snrpg
-0.228
krtt1c19e
0.373
marcksb
-0.227
mgst1.2
0.372
zgc:110216
-0.224
zgc:111983
0.369
hmgb2b
-0.222
si:dkeyp-51b9.3
0.369
tspan7
-0.220
apodb
0.367
dut
-0.218
si:ch73-52f15.5
0.366
hmgn3
-0.217
krt17
0.365
h3f3a
-0.217
zgc:162730
0.362
si:ch211-288g17.3
-0.215
rhbg
0.360
BX927258.1
-0.215
sod1
0.359
si:ch73-1a9.3
-0.212
tmem176l.4
0.357
snrpe
-0.206
tob1b
0.355
znfl2a
-0.202
si:ch211-195b11.3
0.354
nid2a
-0.202
stard14
0.350
nucks1a
-0.200
ddx21
0.347
slbp
-0.198
stx11b.1
0.346
cks1b
-0.198
dhrs13a.2
0.345
ilf2
-0.195
rplp2
0.342
XLOC-001964
-0.195
si:dkey-33c14.3
0.340
mki67
-0.191
pnp5a
0.340
ddx39ab
-0.189
selenow2b
0.337
smarce1
-0.188
anxa1a
0.333
marcksl1b
-0.188
si:ch211-157c3.4
0.329
snrpf
-0.188
chac1
0.327
alyref
-0.188
rhcga
0.326
zgc:110425
-0.187
romo1
0.323
rrm2
-0.187
epdl1
0.323
lbr
-0.186