Daniocell
dlx5a (blastomeres)
distal-less homeobox 5a
ZFIN
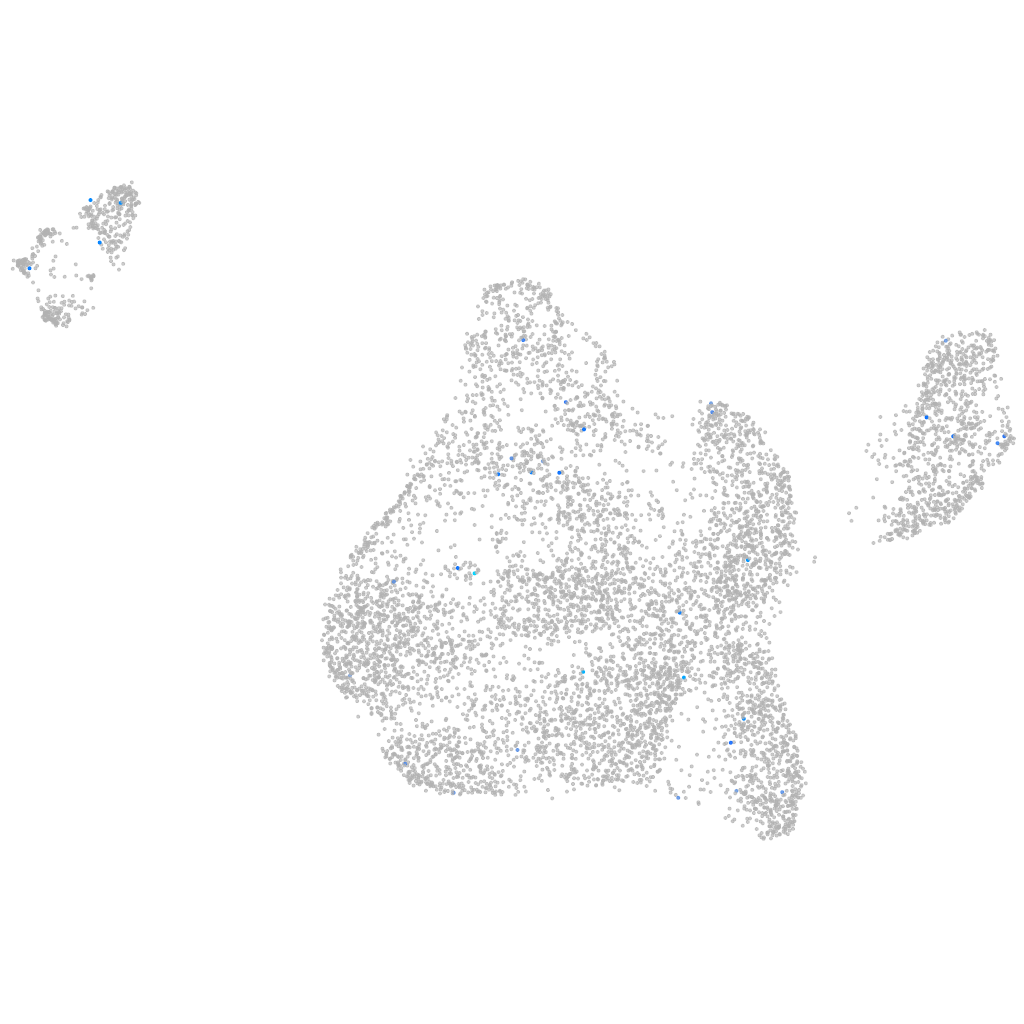
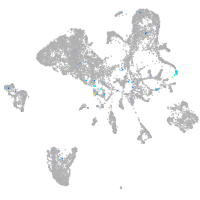
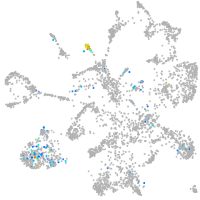
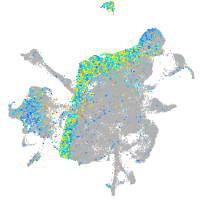
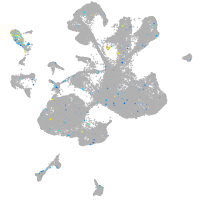
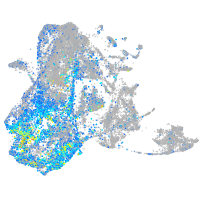
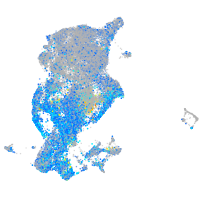
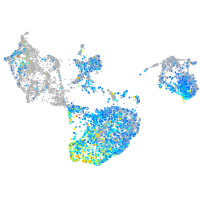
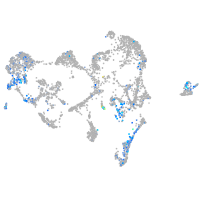
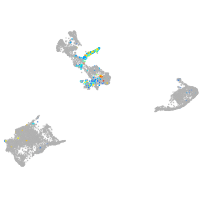
Gene expression UMAP
Display:
Expression
Stage
Other cell groups
all cells
blastomeres
PGCs
endoderm
axial mesoderm
muscle
mural cells /
non-skeletal muscle
mesenchyme
hematopoietic /
vasculature
pronephros
neural
spinal cord / glia
eye
taste / olfactory
otic / lateral line
epidermis
periderm
fin
ionocytes / mucous
pigment cells
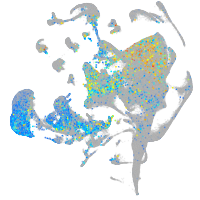
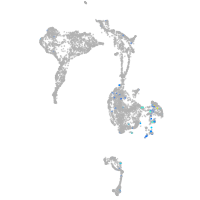
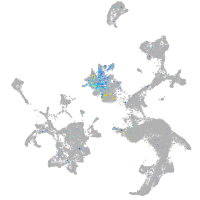
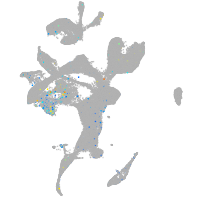
Expression by stage/cluster
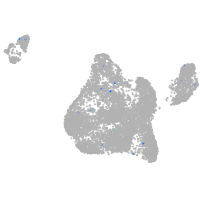
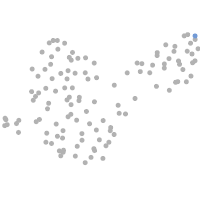
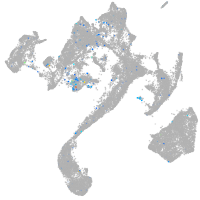
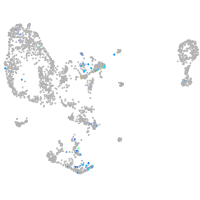
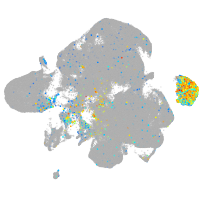
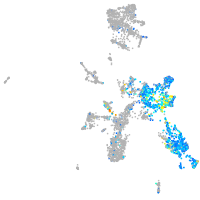
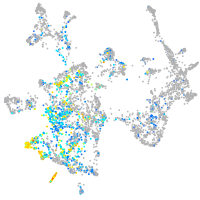
Correlated gene expression
Positive correlation
Negative correlation
Gene
r
Gene
r
CABZ01073795.1
0.330
hspb1
-0.037
si:dkey-149i17.11
0.232
marcksl1b
-0.029
LOC110438109
0.214
ran
-0.028
zgc:77748
0.214
rpl5b
-0.027
LO018605.2
0.205
snrpf
-0.026
si:dkey-40g16.5
0.196
LOC108190024
-0.026
tcap
0.185
sumo1
-0.025
p2rx3b
0.182
hnrnpabb
-0.025
ugt5d1
0.173
twsg1b
-0.025
ora3
0.172
rps3a
-0.025
LOC103911207
0.171
etf1b
-0.025
si:dkey-78l4.13
0.170
ccnb3
-0.024
LOC110439478
0.161
rab2a
-0.024
CR848788.2
0.155
ngdn
-0.023
XLOC-025686
0.153
acvr1l
-0.023
ahr1a
0.152
asb11
-0.023
prkceb
0.152
sox19a
-0.023
si:ch211-215d8.2
0.141
carm1
-0.023
npbwr2a
0.139
eef1a1l1
-0.023
htr2cl1
0.137
mt-co2
-0.023
LOC110438194
0.137
pum1
-0.023
zgc:153920
0.134
top2a
-0.023
pgr
0.134
rhoab
-0.022
XLOC-007853
0.120
nr6a1a
-0.022
zgc:194252
0.120
hmga1a
-0.022
zbtb42
0.118
polr2eb
-0.022
XLOC-004075
0.116
uba2
-0.022
rnf207b
0.114
srsf5a
-0.022
or107-1
0.114
hnrnpa0b
-0.022
irf2
0.114
rpsa
-0.022
si:rp71-45g20.11
0.113
rhoaa
-0.021
CR847897.1
0.113
si:ch73-144d13.4
-0.021
LOC110438607
0.111
cirbpb
-0.021
LOC108182424
0.111
rpl32
-0.021
sgca
0.110
mrpl9
-0.021