Daniocell
def6c (mesenchyme)
DEF6 guanine nucleotide exchange factor c
ZFIN
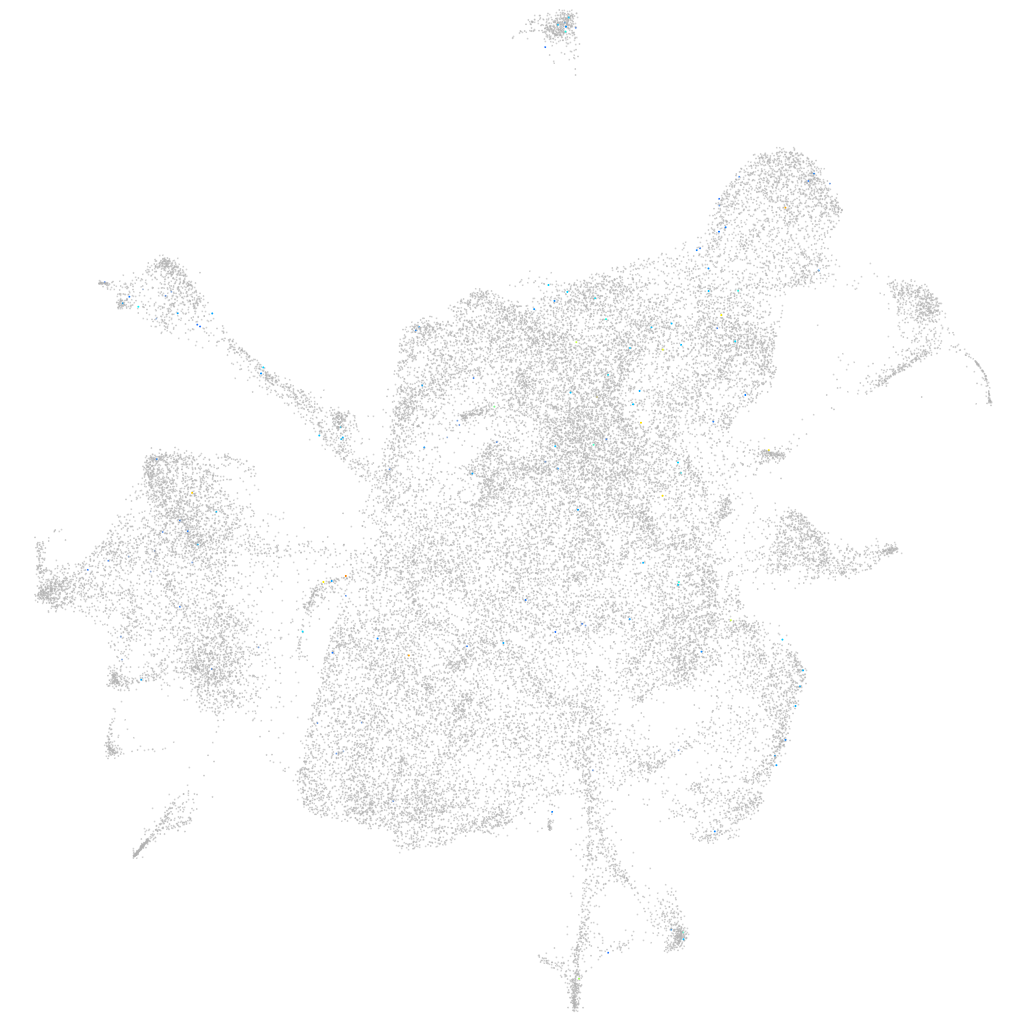
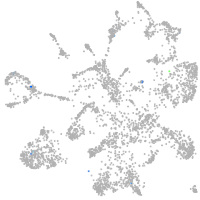
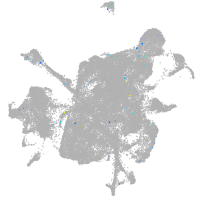
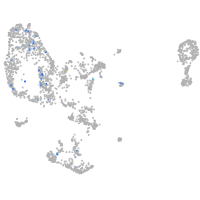
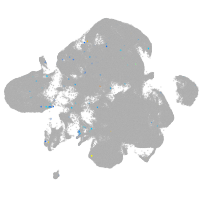
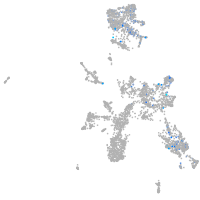
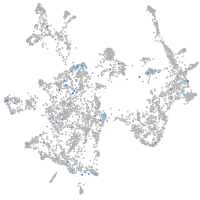
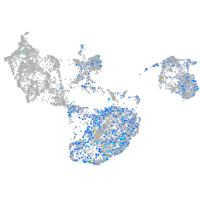
Gene expression UMAP
Display:
Expression
Stage
Other cell groups
all cells
blastomeres
PGCs
endoderm
axial mesoderm
muscle
mural cells /
non-skeletal muscle
mesenchyme
hematopoietic /
vasculature
pronephros
neural
spinal cord / glia
eye
taste / olfactory
otic / lateral line
epidermis
periderm
fin
ionocytes / mucous
pigment cells
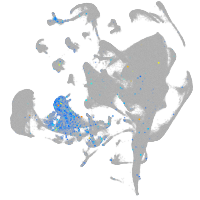
Expression by stage/cluster
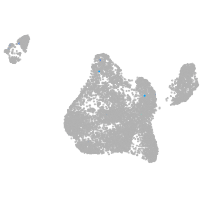
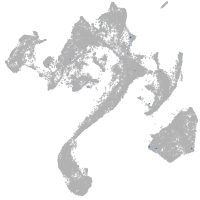
Correlated gene expression
Positive correlation
Negative correlation
Gene
r
Gene
r
BX469896.1
0.157
hmgn2
-0.025
XLOC-014769
0.118
si:ch73-281n10.2
-0.025
si:ch211-253p18.2
0.107
hmga1a
-0.022
LOC101884357
0.106
hmgb2a
-0.021
LOC100536800
0.090
si:ch211-288g17.3
-0.021
taar20c
0.089
snrpf
-0.020
znf366
0.089
si:ch73-1a9.3
-0.020
si:dkey-88n24.10
0.088
magoh
-0.020
CU570769.3
0.080
h2afvb
-0.020
si:ch211-277c7.6
0.077
hnrnpa0b
-0.019
BX539307.2
0.077
ptmab
-0.018
zmp:0000001006
0.071
cbx3a
-0.018
rxfp3
0.069
h2afva
-0.018
zgc:92360
0.067
rpl37
-0.018
LOC100004944
0.066
rps28
-0.018
tp73
0.065
snrpe
-0.017
XLOC-013689
0.064
stmn1a
-0.017
CT954240.1
0.064
ranbp1
-0.017
LOC108190811
0.062
srsf1a
-0.017
LOC110440019
0.058
ddx39ab
-0.017
LOC101885065
0.055
nutf2l
-0.017
slc9a3.1
0.054
cks1b
-0.017
glipr2
0.054
lbr
-0.017
vsig10
0.053
lsm7
-0.016
LOC100534829
0.053
hmgb2b
-0.016
masp2
0.052
sinhcafl
-0.016
LOC103908636
0.052
tubb2b
-0.016
atp8b1
0.052
ywhaqb
-0.016
cfhl2
0.051
hnrnpabb
-0.016
LO017847.1
0.050
mad2l1
-0.016
cyb5d1
0.050
cirbpa
-0.016
cblc
0.050
ndufa8
-0.016
slc26a4
0.048
myef2
-0.016
pak6b
0.048
smarce1
-0.016
CU019646.1
0.048
mki67
-0.016