Daniocell
ddx31 (pigment cells)
DEAD (Asp-Glu-Ala-Asp) box polypeptide 31
ZFIN
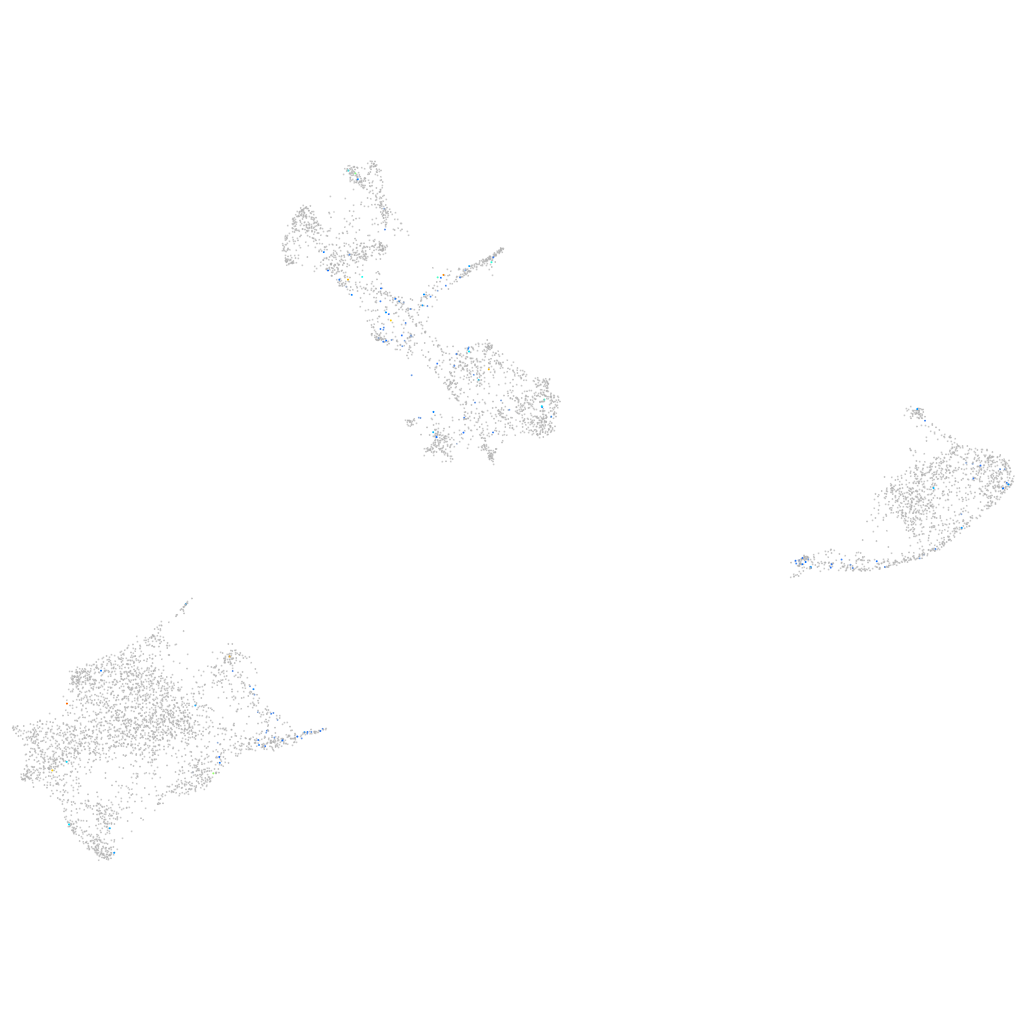
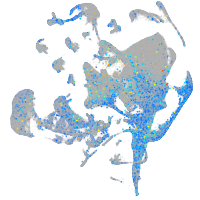
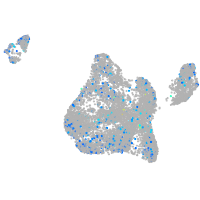
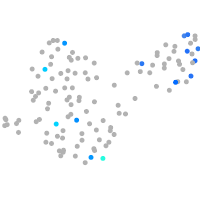
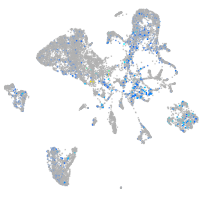
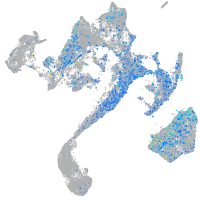
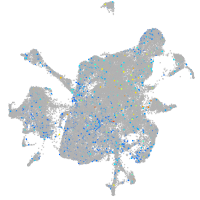
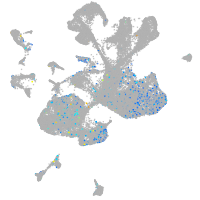
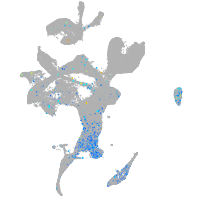
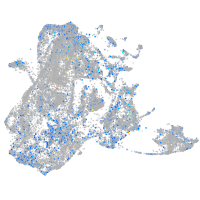
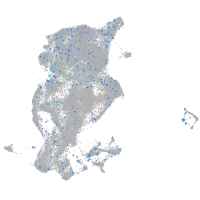
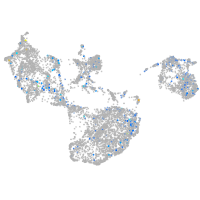
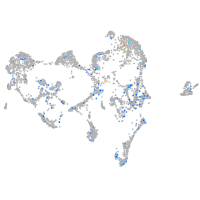
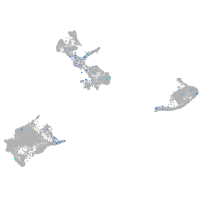
Gene expression UMAP
Display:
Expression
Stage
Other cell groups
all cells
blastomeres
PGCs
endoderm
axial mesoderm
muscle
mural cells /
non-skeletal muscle
mesenchyme
hematopoietic /
vasculature
pronephros
neural
spinal cord / glia
eye
taste / olfactory
otic / lateral line
epidermis
periderm
fin
ionocytes / mucous
pigment cells
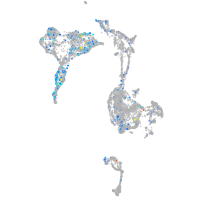
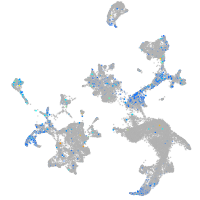
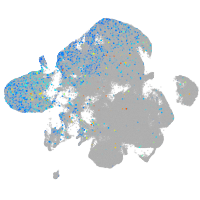
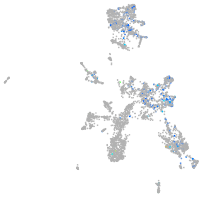
Expression by stage/cluster
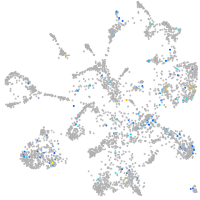
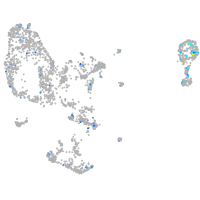
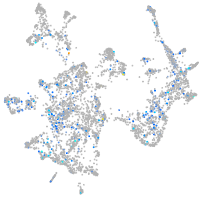
Correlated gene expression
Positive correlation
Negative correlation
Gene
r
Gene
r
LOC110439374
0.251
gstp1
-0.089
BX510934.2
0.248
gch2
-0.063
BX927243.2
0.221
zgc:110339
-0.061
LOC553308
0.201
mdh1aa
-0.056
CABZ01073083.1
0.199
si:dkey-251i10.2
-0.055
si:dkey-45d16.4
0.163
uraha
-0.052
XLOC-007300
0.163
CABZ01021592.1
-0.052
ssuh2.3
0.152
marcksl1b
-0.052
adipoqb
0.150
pvalb2
-0.051
plek
0.147
slc22a7a
-0.050
pdlim3b
0.146
cotl1
-0.049
si:ch211-196f2.3
0.132
actc1b
-0.048
RF00548
0.132
s100a10b
-0.043
ahsg1
0.130
akr1b1
-0.042
CU499330.1
0.121
tnni2a.4
-0.042
zgc:173517
0.121
pvalb1
-0.042
si:dkey-261m9.12
0.120
oxr1b
-0.041
XLOC-000527
0.112
csrp2
-0.041
LOC100537853
0.111
zgc:153031
-0.039
CR377211.1
0.108
cd63
-0.039
si:dkeyp-80c12.7
0.108
hbbe1.3
-0.038
LOC100330136
0.106
tmem130
-0.037
nop58
0.105
pts
-0.037
btr23
0.104
actb2
-0.036
LOC108183387
0.104
vat1
-0.035
ptgfrn
0.103
aqp3a
-0.034
ebna1bp2
0.100
cyt1
-0.033
BX088709.1
0.099
pik3c3
-0.033
adcy2a
0.098
sult1st1
-0.032
rrp1
0.097
hbae1.1
-0.032
c1qbp
0.096
prdx1
-0.032
snu13b
0.095
ccni
-0.031
abcc10
0.095
txn
-0.031
LOC103910136
0.095
nme2b.2
-0.031
sox8a
0.094
pfn1
-0.030