Daniocell
dcaf15 (mesenchyme)
DDB1 and CUL4 associated factor 15
ZFIN
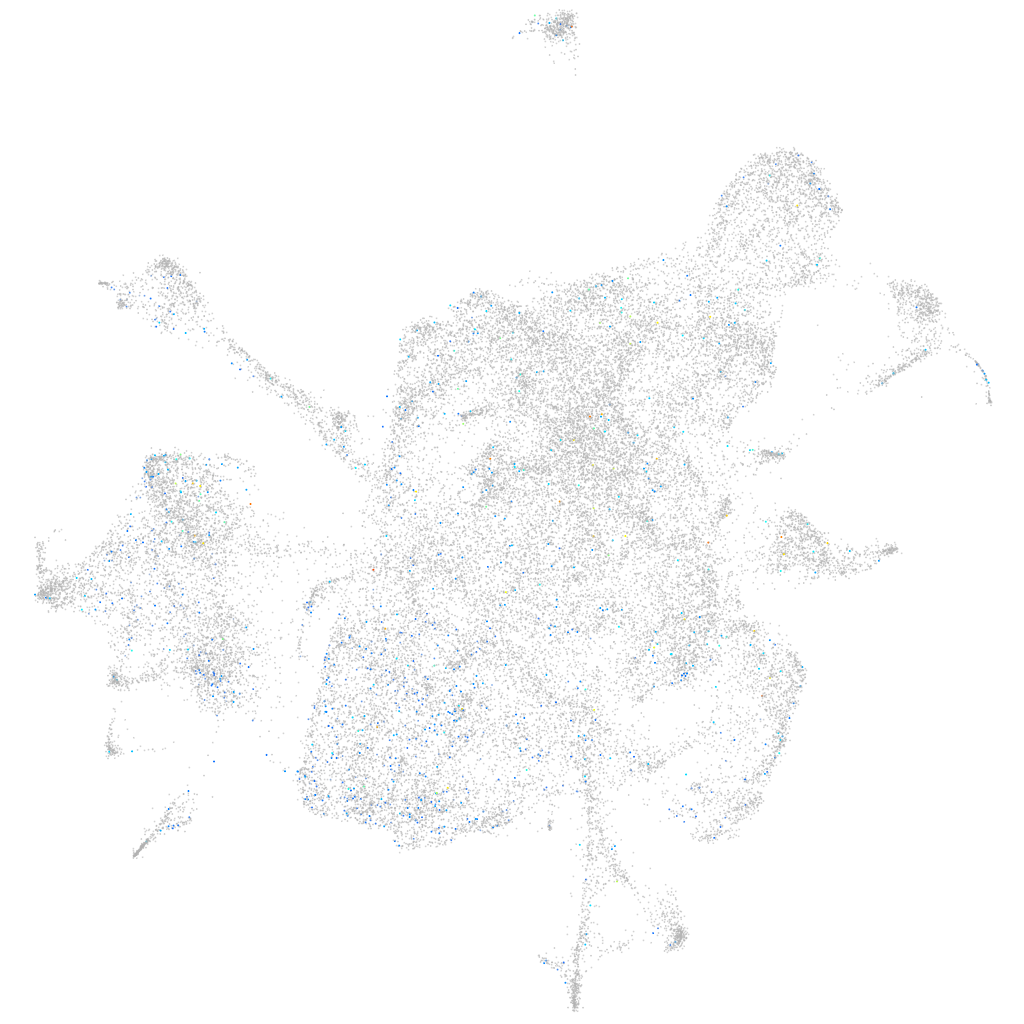
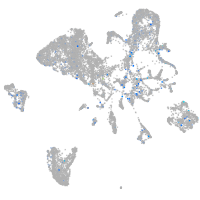
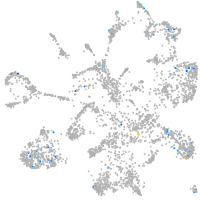
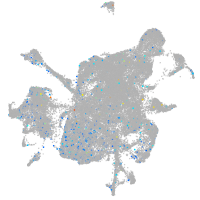
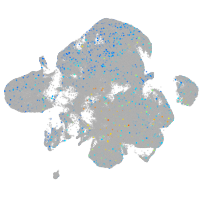
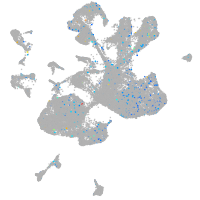
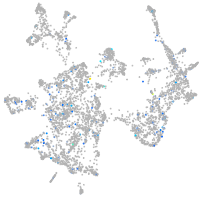
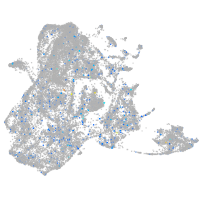
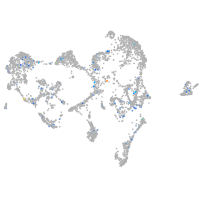
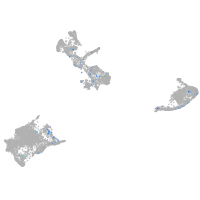
Gene expression UMAP
Display:
Expression
Stage
Other cell groups
all cells
blastomeres
PGCs
endoderm
axial mesoderm
muscle
mural cells /
non-skeletal muscle
mesenchyme
hematopoietic /
vasculature
pronephros
neural
spinal cord / glia
eye
taste / olfactory
otic / lateral line
epidermis
periderm
fin
ionocytes / mucous
pigment cells
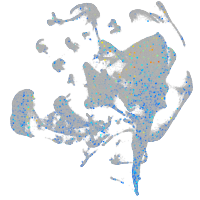
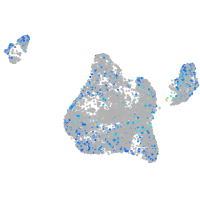
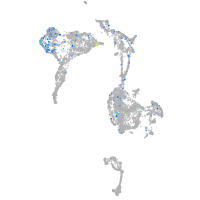
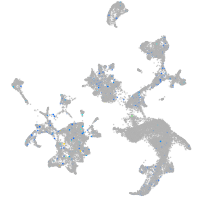
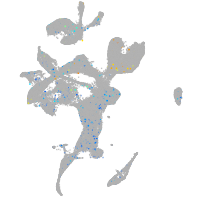
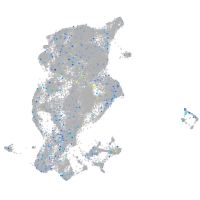
Expression by stage/cluster
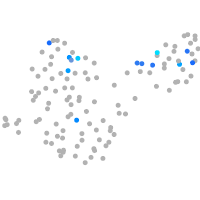
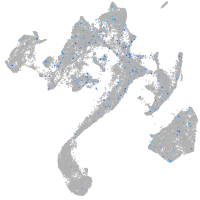
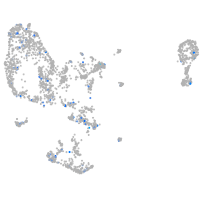
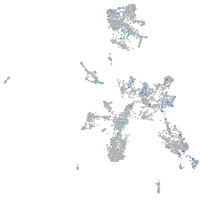
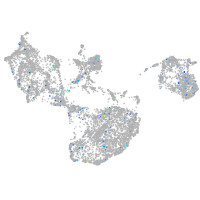
Correlated gene expression
Positive correlation
Negative correlation
Gene
r
Gene
r
LOC103910749
0.075
rpl39
-0.024
si:ch211-286b5.9
0.070
apoa2
-0.022
ecm1a
0.062
apoa1b
-0.022
si:ch1073-205c8.5
0.060
rpl37
-0.021
si:dkey-73p2.1
0.058
rplp1
-0.020
smc2
0.057
VIT
-0.018
esrrd
0.057
rbp4
-0.018
LOC101884638
0.055
lxn
-0.018
mki67
0.055
cebpd
-0.017
arf4b
0.054
sec61g
-0.017
tubb2b
0.053
tob1b
-0.017
LOC797340
0.052
pvalb1
-0.017
LOC103909381.1
0.052
dap1b
-0.017
BX571694.1
0.052
cnmd
-0.016
top2a
0.052
tmem176l.1
-0.016
si:dkey-108k21.10
0.051
ttc36
-0.016
XLOC-026746
0.051
prss59.1
-0.015
aurkb
0.051
si:dkey-151g10.6
-0.015
cldnd
0.050
rps28
-0.015
ccna2
0.050
ela2l
-0.015
cks1b
0.050
rps21
-0.015
fbxo5
0.050
ifitm1
-0.015
FO203364.1
0.050
b2ml
-0.015
si:ch73-41e3.7
0.050
ctrb1
-0.015
zgc:110425
0.049
rpl29
-0.015
LOC108181095
0.049
si:ch211-251b21.1
-0.015
XLOC-034550
0.049
CABZ01092746.1
-0.015
CABZ01080098.1
0.049
mia
-0.014
lpar4
0.049
rps29
-0.014
LOC101882590
0.049
actc1b
-0.014
lbr
0.048
bhmt
-0.014
si:dkey-261m9.17
0.048
col9a2
-0.014
ncapd2
0.048
faua
-0.014
tpx2
0.048
fabp10a
-0.014
slc25a15a
0.048
otos
-0.014