Daniocell
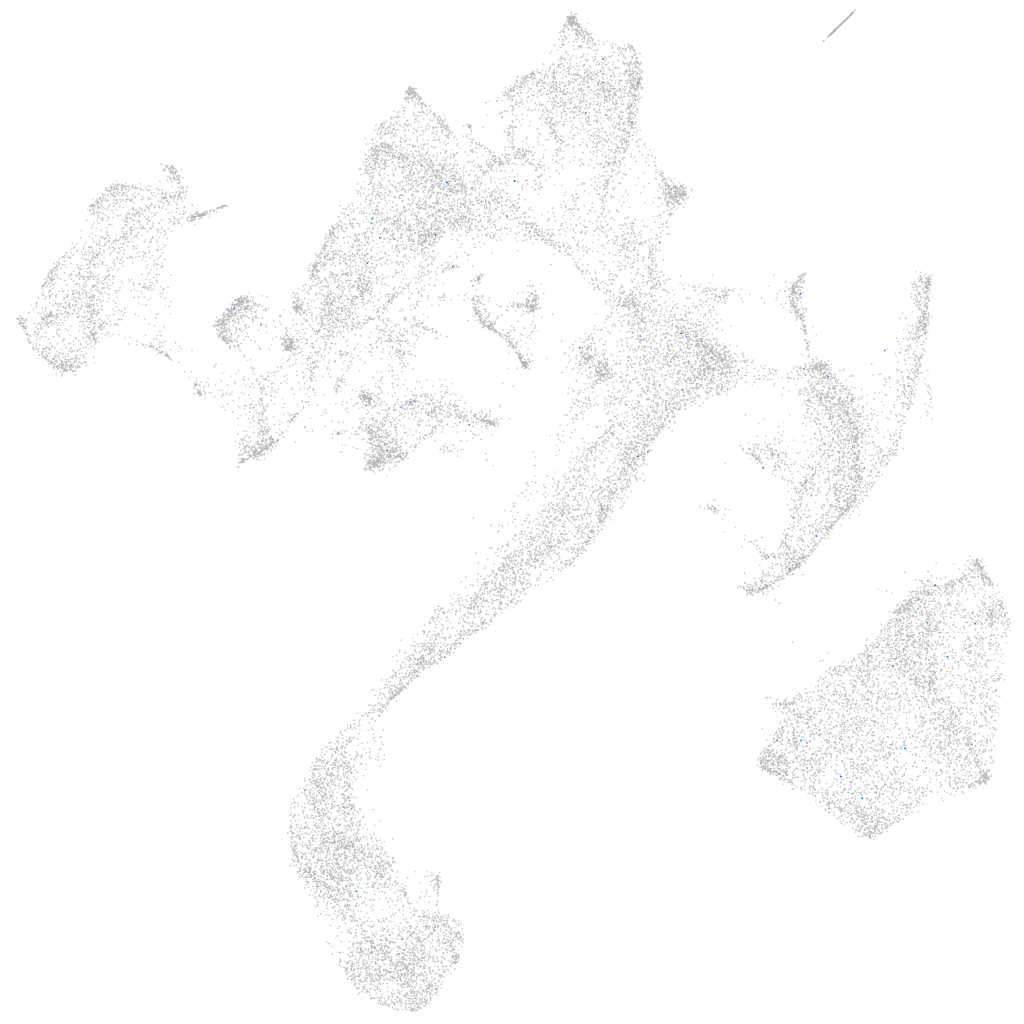
cyp11c1 (muscle)
"cytochrome P450, family 11, subfamily C, polypeptide 1"
ZFIN
Gene expression UMAP
Display:
Expression
Stage
Other cell groups
all cells
blastomeres
PGCs
endoderm
axial mesoderm
muscle
mural cells /
non-skeletal muscle
mesenchyme
hematopoietic /
vasculature
pronephros
neural
spinal cord / glia
eye
taste / olfactory
otic / lateral line
epidermis
periderm
fin
ionocytes / mucous
pigment cells
Expression by stage/cluster
Correlated gene expression
Positive correlation
Negative correlation
Gene
r
Gene
r
ros1
0.188
actc1b
-0.022
si:ch73-106l15.4
0.146
atp2a1
-0.022
si:dkeyp-3f10.16
0.140
gapdh
-0.022
si:dkey-151m22.8
0.139
aldoab
-0.022
CR354537.1
0.107
smyd1a
-0.021
n4bp3
0.106
ckmb
-0.021
CU302323.1
0.102
ckma
-0.021
XLOC-000597
0.099
ndufa2
-0.020
LOC101883538
0.097
ldb3a
-0.020
XLOC-040068
0.095
ttn.2
-0.020
RAMP3
0.091
nme2b.2
-0.020
LOC103911482
0.089
srl
-0.020
si:dkeyp-77c4.5
0.089
rtn2a
-0.020
BEND4
0.083
cavin4b
-0.020
si:dkey-33m11.8
0.082
COX3
-0.020
si:dkey-112g5.13
0.079
CABZ01072309.1
-0.019
si:ch211-238e22.2
0.079
mt-co2
-0.019
LOC101882358
0.078
si:ch211-266g18.10
-0.019
spire2
0.075
ldb3b
-0.019
si:dkey-185m8.2
0.073
mybphb
-0.019
pcyt1bb
0.070
cav3
-0.019
BX649481.1
0.069
jph1b
-0.019
snx19a
0.068
actn3a
-0.019
LOC103910570
0.067
tnnc2
-0.019
BX293559.1
0.067
mef2ca
-0.019
LOC110437994
0.064
tmem38a
-0.019
RF01192
0.063
ttn.1
-0.019
gucy2f
0.062
ak1
-0.019
si:dkey-157e10.8
0.060
trdn
-0.019
si:dkey-11o1.3
0.057
pabpc4
-0.019
BX119902.2
0.056
tpi1b
-0.019
XLOC-029568
0.055
gamt
-0.019
si:ch211-189k9.2
0.055
si:dkey-16p21.8
-0.018
styk1a
0.054
zgc:101853
-0.018
CR545469.1
0.053
desma
-0.018