Daniocell
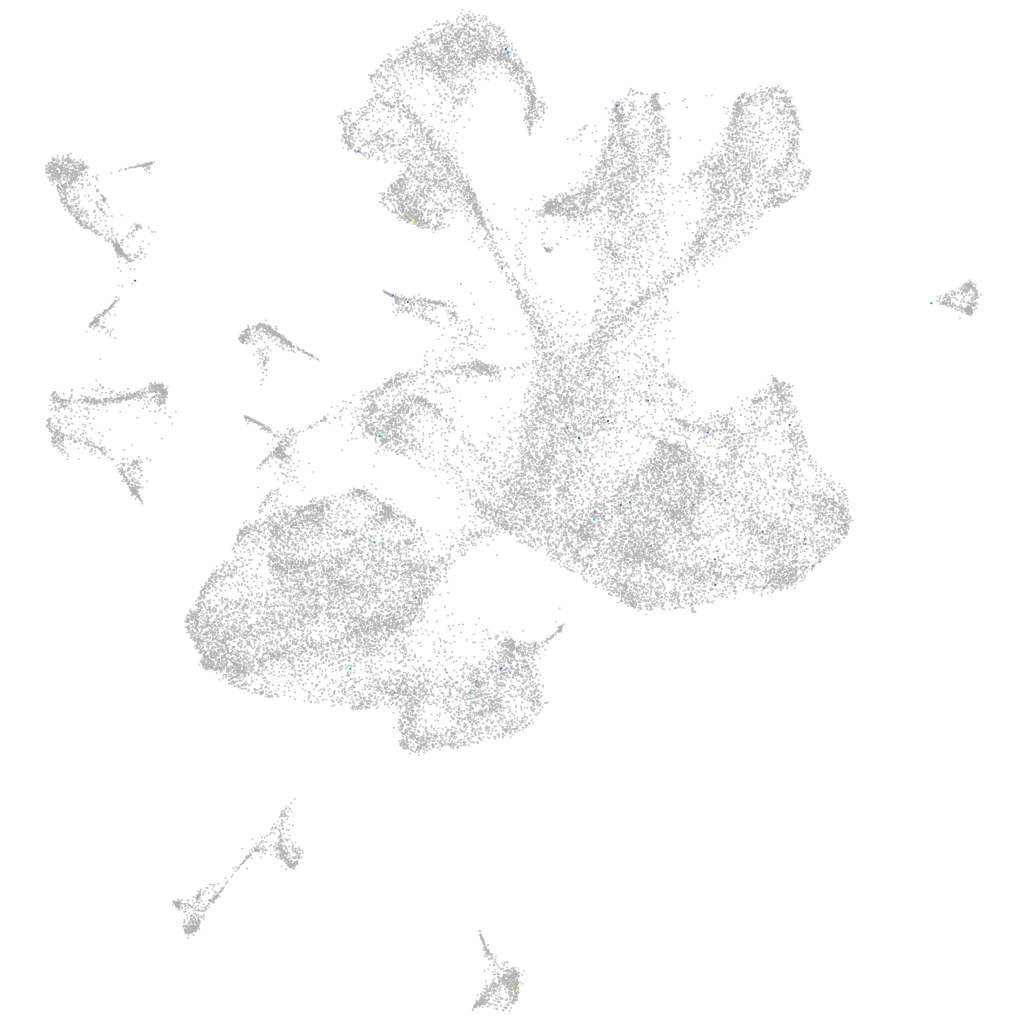
cyp11c1 (glial cells / spinal cord)
"cytochrome P450, family 11, subfamily C, polypeptide 1"
ZFIN
Gene expression UMAP
Display:
Expression
Stage
Other cell groups
all cells
blastomeres
PGCs
endoderm
axial mesoderm
muscle
mural cells /
non-skeletal muscle
mesenchyme
hematopoietic /
vasculature
pronephros
neural
spinal cord / glia
eye
taste / olfactory
otic / lateral line
epidermis
periderm
fin
ionocytes / mucous
pigment cells
Expression by stage/cluster
Correlated gene expression
Positive correlation
Negative correlation
Gene
r
Gene
r
LO018432.1
0.168
gpm6aa
-0.020
prlrb
0.131
tnrc6c1
-0.018
XLOC-028453
0.087
ckbb
-0.017
cacna1eb
0.083
gpm6ab
-0.017
LOC101887121
0.082
si:ch211-251b21.1
-0.016
dgat2
0.080
hmgb1a
-0.016
LOC103911848
0.079
COX3
-0.016
XLOC-042928
0.077
cadm4
-0.016
LOC101886158
0.076
srgap3
-0.016
kcnj1a.6
0.074
pvalb2
-0.015
si:ch211-198g14.4
0.070
actc1b
-0.015
LOC101884740
0.069
appb
-0.015
CT583626.1
0.068
rtn1a
-0.015
polr3g
0.067
tmco1
-0.014
LOC103909459
0.067
cst3
-0.014
myo7bb
0.066
pvalb1
-0.014
CR354430.3
0.066
gapdhs
-0.014
FO904901.1
0.063
CU467822.1
-0.013
LOC103911603
0.062
dbn1
-0.013
CU896640.1
0.059
stx1b
-0.013
AL840638.2
0.058
si:dkeyp-75h12.5
-0.013
XLOC-042265
0.057
mdh1aa
-0.013
cyp1c1
0.055
mdh2
-0.013
slc24a4b
0.055
dda1
-0.013
si:ch73-256j6.4
0.052
bsdc1
-0.013
mir9-5
0.050
rnasekb
-0.013
LOC108183534
0.050
syt2a
-0.013
CR352209.1
0.050
atp2b2
-0.013
LOC103911624
0.050
stmn2a
-0.013
si:dkey-17e16.15
0.049
IGLON5
-0.013
epha8
0.048
sox9a
-0.013
ect2l
0.047
kdm6bb
-0.012
LOC101885698
0.046
syt11a
-0.012
si:dkey-7j22.4
0.046
id4
-0.012
LOC108183566
0.046
ip6k2b
-0.012