Daniocell
cutc (blastomeres)
cutC copper transporter homolog (E. coli)
ZFIN
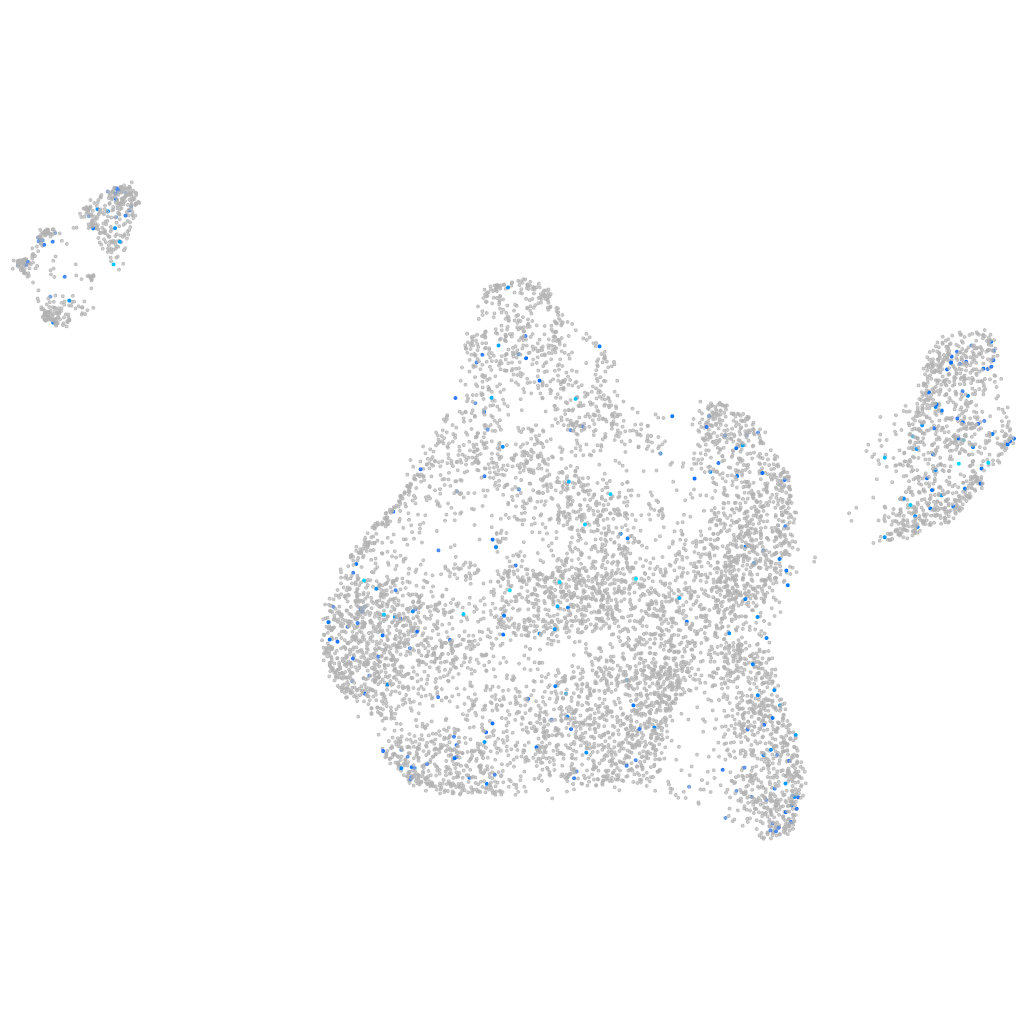
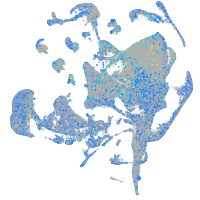
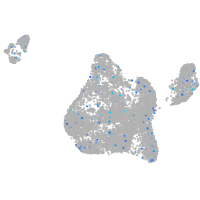
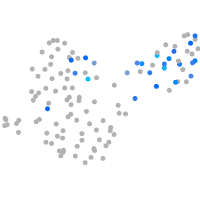
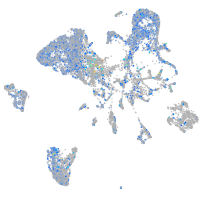
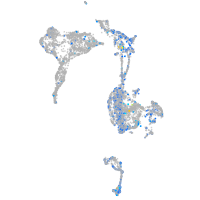
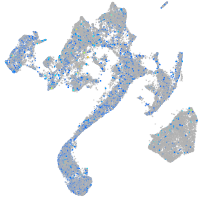
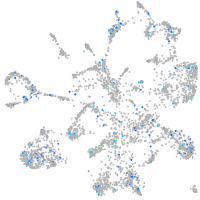
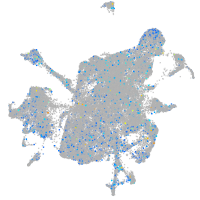
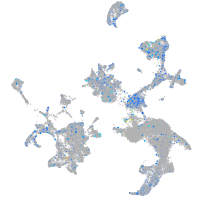
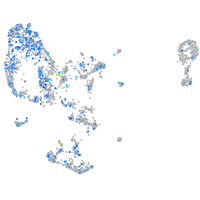
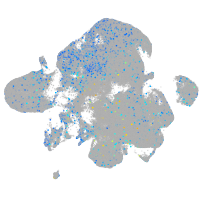
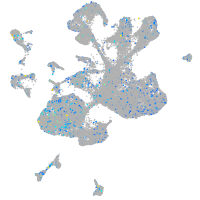
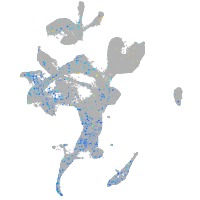
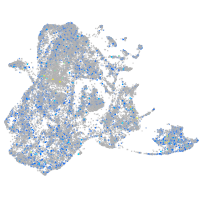
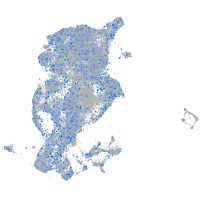
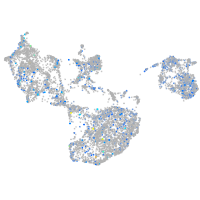
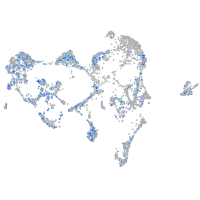
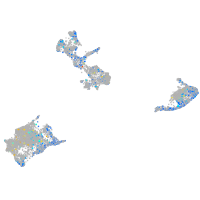
Gene expression UMAP
Display:
Expression
Stage
Other cell groups
all cells
blastomeres
PGCs
endoderm
axial mesoderm
muscle
mural cells /
non-skeletal muscle
mesenchyme
hematopoietic /
vasculature
pronephros
neural
spinal cord / glia
eye
taste / olfactory
otic / lateral line
epidermis
periderm
fin
ionocytes / mucous
pigment cells
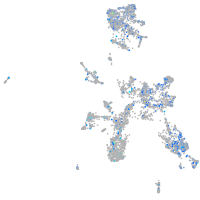
Expression by stage/cluster
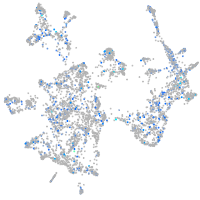
Correlated gene expression
Positive correlation
Negative correlation
Gene
r
Gene
r
LOC103912066
0.114
NC-002333.4
-0.049
serinc4
0.105
rps15
-0.045
stk24a
0.105
rplp1
-0.044
pdgfrl
0.101
hmgb2a
-0.041
LOC110439324
0.100
si:ch73-1a9.3
-0.041
si:dkeyp-4c4.2
0.100
rpl13a
-0.040
npas4a
0.098
polr3gla
-0.038
LOC110438013
0.097
npm1a
-0.038
XLOC-014827
0.097
hspb1
-0.036
gabrr2a
0.096
si:ch211-222l21.1
-0.035
CR925723.3
0.094
stm
-0.035
stx12l
0.089
rpl11
-0.034
tac4
0.086
akap12b
-0.034
LOC793010
0.085
eef1a1l1
-0.034
LOC110440141
0.085
apela
-0.034
BX936433.2
0.084
rpl7
-0.034
BX284635.1
0.084
lrwd1
-0.033
dyrk4
0.079
her7
-0.033
kcnj8
0.077
marcksl1b
-0.033
lingo3a
0.077
rpl14
-0.032
kcnj2b
0.076
chd4b
-0.032
CT027583.2
0.075
rps15a
-0.032
XLOC-007663
0.075
anp32a
-0.032
wu:fj49a02
0.075
XLOC-007665
-0.032
LOC101885134
0.074
si:ch211-137a8.4
-0.031
ccdc151
0.074
cbfa2t2
-0.031
frem1a
0.073
sp5l
-0.031
flvcr2a
0.073
ss18l2
-0.030
iqch
0.072
hnrnpa0b
-0.030
tmprss13a
0.071
naca
-0.030
nos1apb
0.071
UTP14C
-0.030
XLOC-013197
0.071
CR383676.2
-0.030
LOC110438288
0.070
b3gnt2b
-0.030
cldn7b
0.069
ccnf
-0.030
cbln11
0.069
rps19
-0.029