Daniocell
cskl (axial mesoderm)
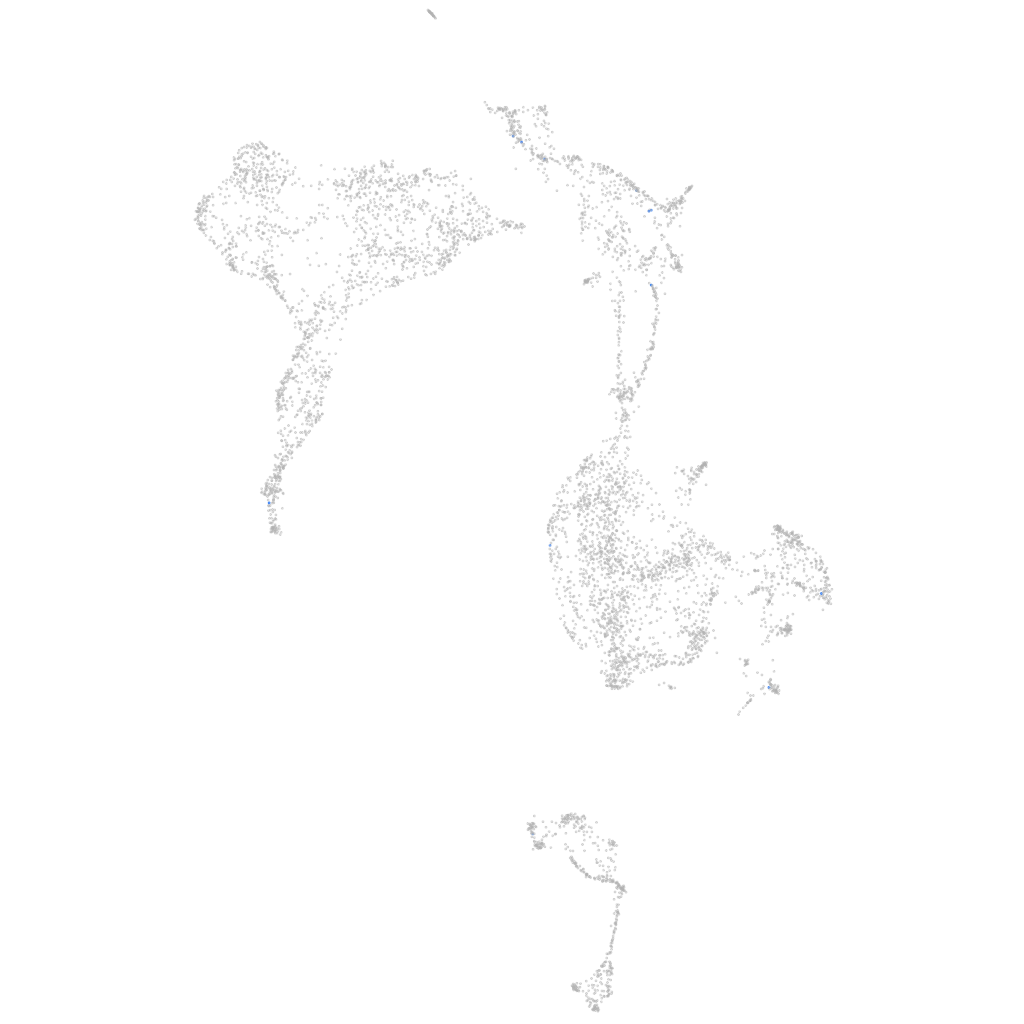
c-src tyrosine kinase-like
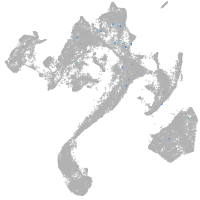
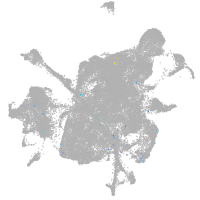
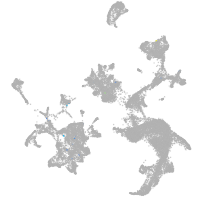
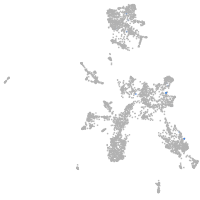
Gene expression UMAP
Display:
Expression
Stage
Other cell groups
all cells
blastomeres
PGCs
endoderm
axial mesoderm
muscle
mural cells /
non-skeletal muscle
mesenchyme
hematopoietic /
vasculature
pronephros
neural
spinal cord / glia
eye
taste / olfactory
otic / lateral line
epidermis
periderm
fin
ionocytes / mucous
pigment cells
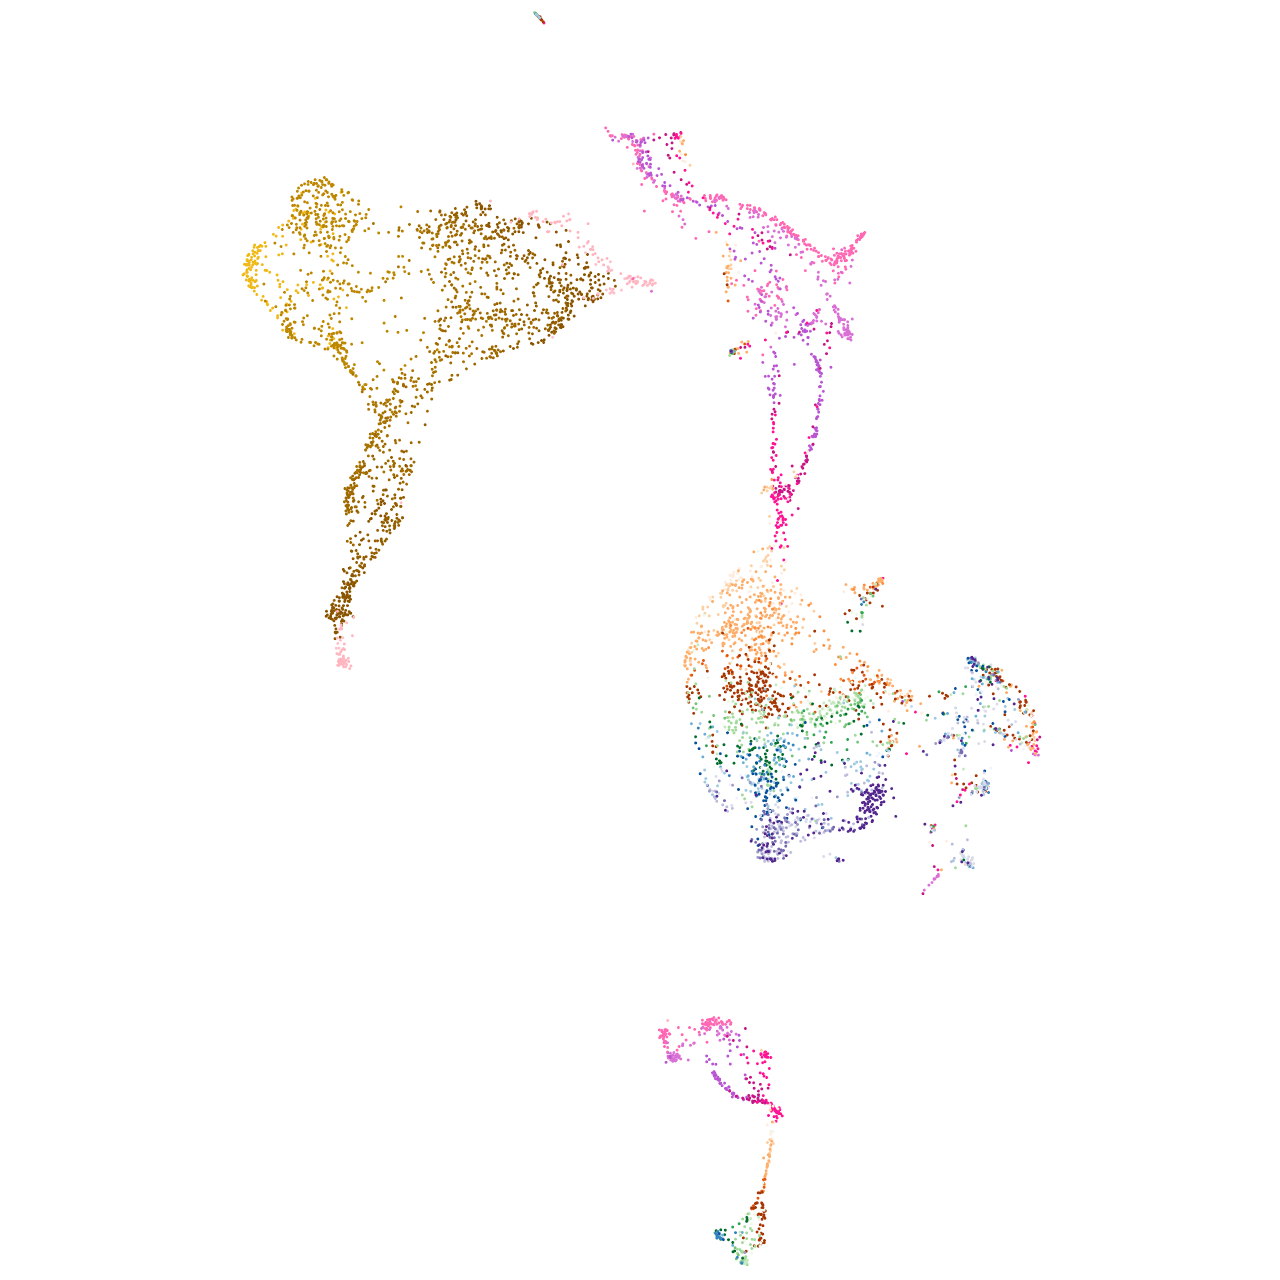
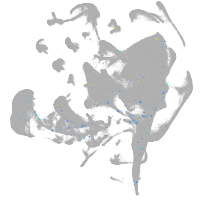
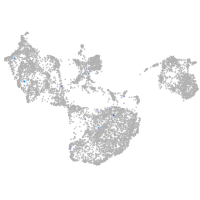
Expression by stage/cluster
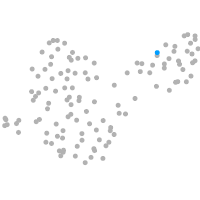
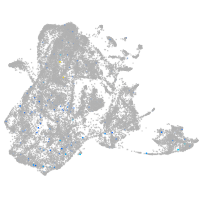
Correlated gene expression
Positive correlation
Negative correlation
Gene
r
Gene
r
BX248511.1
0.359
si:dkey-16p21.8
-0.025
LOC110439467
0.359
si:ch211-152c2.3
-0.025
mir130c-1
0.340
slc7a8a
-0.024
LOC103911518
0.340
cst3
-0.023
LOC101884145
0.327
marcksl1b
-0.023
CR848791.1
0.301
col11a2
-0.022
abcg2b
0.290
si:dkey-92i17.2
-0.022
LOC101886700
0.290
zgc:56699
-0.022
XLOC-018083
0.282
LO018188.1
-0.022
cfhl2
0.269
mcm3
-0.022
LOC101883803
0.258
cfl1l
-0.021
LOC110438973
0.256
tppp3
-0.021
LOC795066
0.242
thoc7
-0.021
XLOC-019725
0.226
scube2
-0.021
zgc:158701
0.216
si:dkeyp-69c1.6
-0.021
XLOC-042506
0.202
crnkl1
-0.020
ceacam1
0.195
cbx1a
-0.020
nfixa
0.178
si:ch73-160h15.3
-0.020
si:ch73-156l6.2
0.174
tspan31
-0.020
il4
0.166
cmtm6
-0.020
CU459094.1
0.151
brd7
-0.020
wdr78
0.149
tbx16
-0.020
sftpba
0.148
polr2gl
-0.020
CABZ01055365.1
0.148
epyc
-0.020
LOC103911992
0.144
bptf
-0.020
LOC101883789
0.144
sf3a1
-0.020
sim1b
0.143
rbm26
-0.020
grm6a
0.142
krt8
-0.020
ca14
0.139
prpf38b
-0.019
tnfrsf13b
0.136
dcps
-0.019
slc1a8a
0.135
gas2b
-0.019
nitr12
0.133
cnn3b
-0.019
LOC108191324
0.130
atp2b1a
-0.019
LOC110438048
0.129
thbs1b
-0.019
ptprbl
0.123
NC-002333.4
-0.019