Daniocell
csf1b (endoderm)
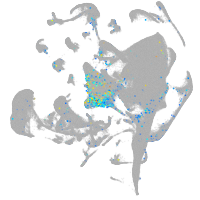
colony stimulating factor 1b (macrophage)
ZFIN
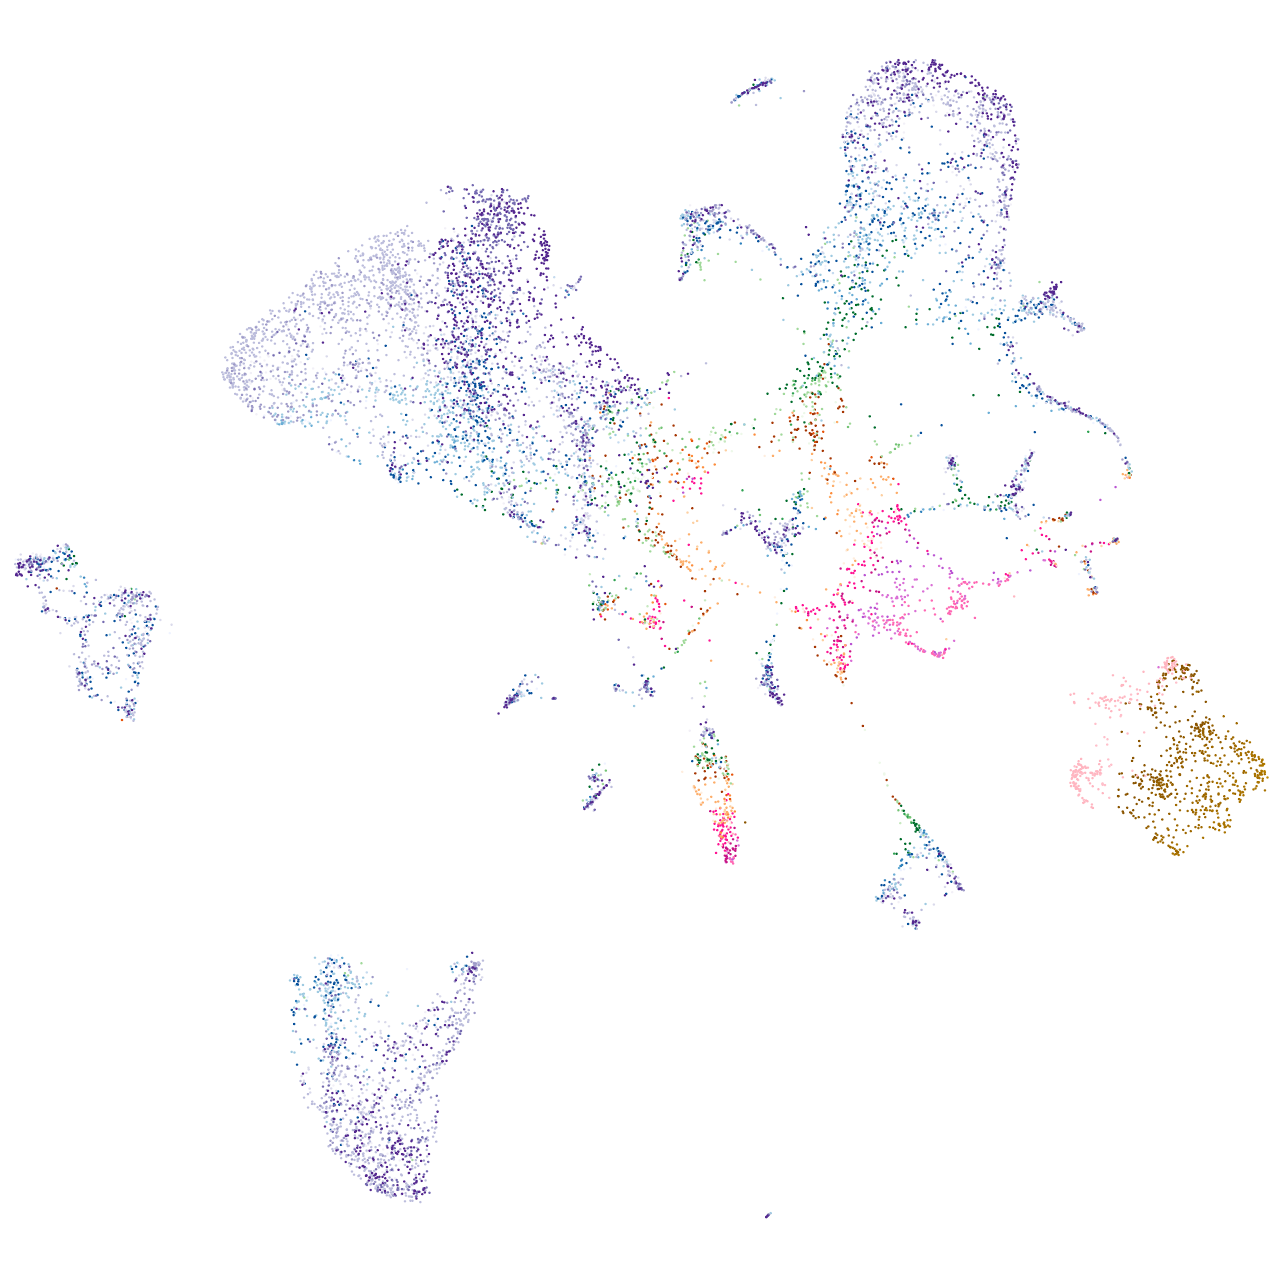
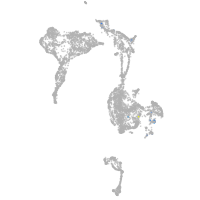
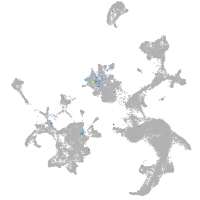
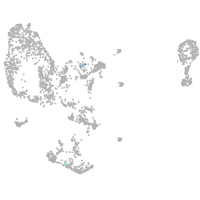
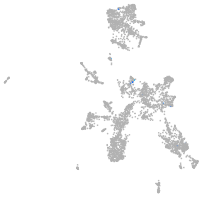
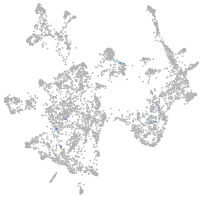
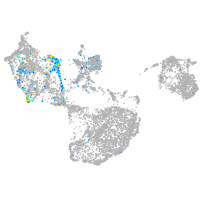
Gene expression UMAP
Display:
Expression
Stage
Other cell groups
all cells
blastomeres
PGCs
endoderm
axial mesoderm
muscle
mural cells /
non-skeletal muscle
mesenchyme
hematopoietic /
vasculature
pronephros
neural
spinal cord / glia
eye
taste / olfactory
otic / lateral line
epidermis
periderm
fin
ionocytes / mucous
pigment cells
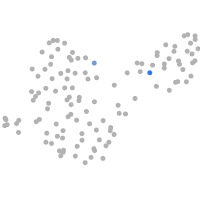
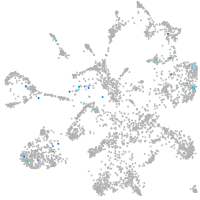
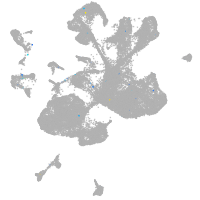
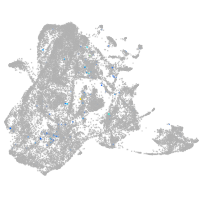
Expression by stage/cluster
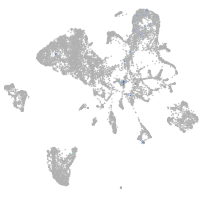
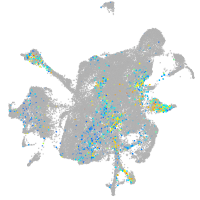
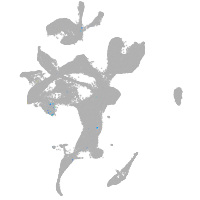
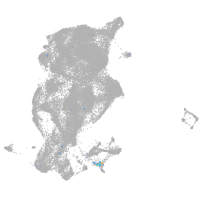
Correlated gene expression
Positive correlation
Negative correlation
Gene
r
Gene
r
zbbx
0.283
fabp3
-0.055
fam155a
0.270
aqp12
-0.054
XLOC-030238
0.232
apoc1
-0.050
CT583646.1
0.220
bhmt
-0.047
lzts3b
0.204
serpina1
-0.046
pmfbp1
0.201
serpina1l
-0.046
BX649476.1
0.195
rbp2b
-0.046
si:ch73-249k16.4
0.181
fabp10a
-0.046
si:dkey-188k17.2
0.176
ttc36
-0.045
BX088583.2
0.165
cpn1
-0.045
znf1179
0.158
agxtb
-0.045
CR381618.1
0.158
vtnb
-0.045
ccdc88aa
0.156
hpda
-0.044
si:ch1073-340j19.1
0.156
uox
-0.044
BX569790.2
0.156
ambp
-0.044
LOC103908683.1
0.153
serpinf2b
-0.044
si:ch211-14a11.2
0.150
fgg
-0.044
LOC103911747
0.143
kng1
-0.043
CR786571.4
0.141
c9
-0.043
LOC100537404
0.138
agxta
-0.043
LOC101882378
0.135
gc
-0.043
si:dkey-175d9.2
0.133
cfhl4
-0.043
LOC107195253
0.133
c8g
-0.043
LOC103910614
0.132
rbp4
-0.042
znf1119
0.128
f2
-0.042
LOC103911284
0.127
LOC110437731
-0.042
pdca
0.126
cfb
-0.042
XLOC-005448
0.126
pygl
-0.042
LOC100007608.1
0.125
ttr
-0.042
l3mbtl1a
0.124
fgb
-0.042
SLC35D3
0.124
apoa2
-0.042
si:ch211-153b23.7
0.121
fetub
-0.042
lrrfip1b
0.120
fga
-0.042
cfap57
0.120
apom
-0.041
ftr64
0.119
serpinc1
-0.041