Daniocell
creld1a (glial cells / spinal cord)
cysteine-rich with EGF-like domains 1a
ZFIN
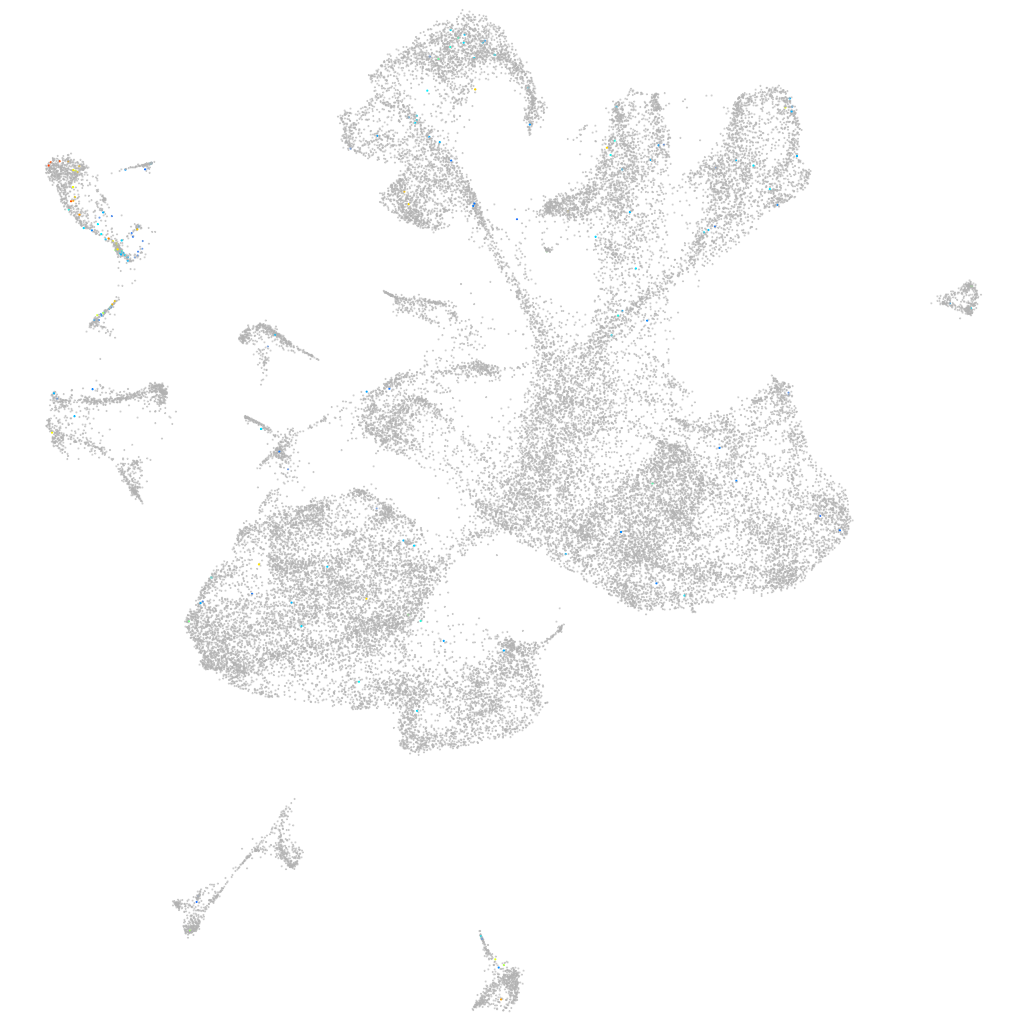
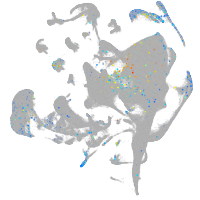
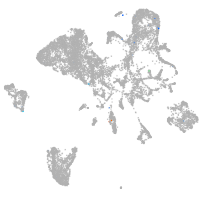
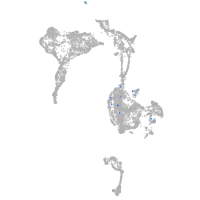
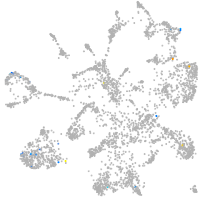
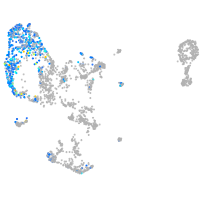
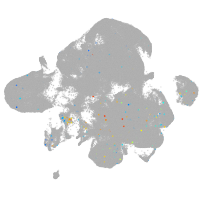
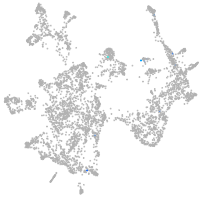
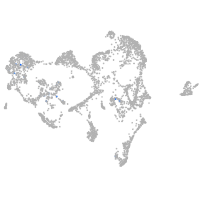
Gene expression UMAP
Display:
Expression
Stage
Other cell groups
all cells
blastomeres
PGCs
endoderm
axial mesoderm
muscle
mural cells /
non-skeletal muscle
mesenchyme
hematopoietic /
vasculature
pronephros
neural
spinal cord / glia
eye
taste / olfactory
otic / lateral line
epidermis
periderm
fin
ionocytes / mucous
pigment cells
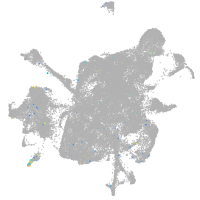
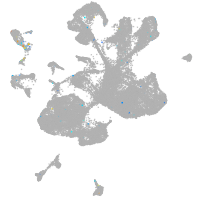
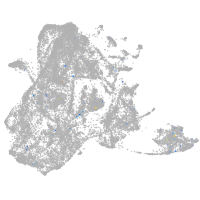
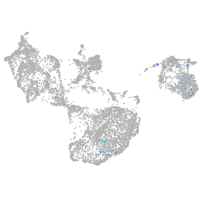
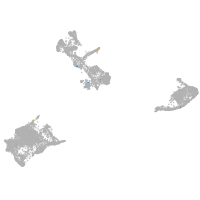
Expression by stage/cluster
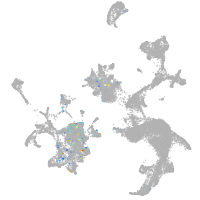
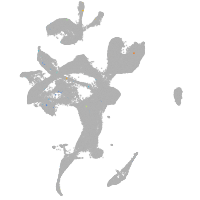
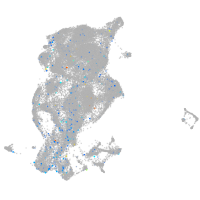
Correlated gene expression
Positive correlation
Negative correlation
Gene
r
Gene
r
scn4ab
0.182
XLOC-003689
-0.042
LOC101883290
0.157
cldn5a
-0.042
tm4sf18
0.130
XLOC-003690
-0.039
col4a1
0.130
sox3
-0.039
LOC110438406
0.124
her15.1
-0.038
lamb1b
0.124
gfap
-0.037
si:ch1073-291c23.2
0.122
XLOC-003692
-0.037
mcamb
0.118
msi1
-0.035
LOC110438484
0.117
sox19a
-0.034
col8a1b
0.114
hmga1a
-0.033
larp6b
0.113
snrpd1
-0.033
col4a2
0.109
her12
-0.033
krt18b
0.103
ddx39ab
-0.033
ly6m5
0.103
lfng
-0.033
BX511021.2
0.102
zgc:165461
-0.032
col18a1b
0.100
seta
-0.032
kng1
0.093
her4.2
-0.032
si:dkey-31g6.6
0.092
her4.1
-0.032
CABZ01081908.1
0.092
abhd6a
-0.031
BX649431.4
0.092
si:ch73-265d7.2
-0.031
hbegfb
0.091
snrpd2
-0.030
kitlgb
0.089
sb:cb81
-0.030
spaw
0.088
rpl21
-0.030
scn1ba
0.087
snrpf
-0.029
CMKLR1 (1 of many)
0.084
h2afvb
-0.029
prokr1a
0.084
dla
-0.029
phlda2
0.084
si:ch211-288g17.3
-0.029
CR354556.2
0.082
si:dkey-151g10.6
-0.029
foxa3
0.082
hmgb1b
-0.029
itgb2
0.081
si:ch211-222l21.1
-0.029
twist2
0.081
si:ch73-21g5.7
-0.029
CR762483.1
0.081
hmgb2a
-0.028
zwi
0.081
nova2
-0.028
ndrg1a
0.080
her2
-0.028
socs3a
0.079
rps21
-0.028