Daniocell
cratb (pigment cells)
carnitine O-acetyltransferase b
ZFIN
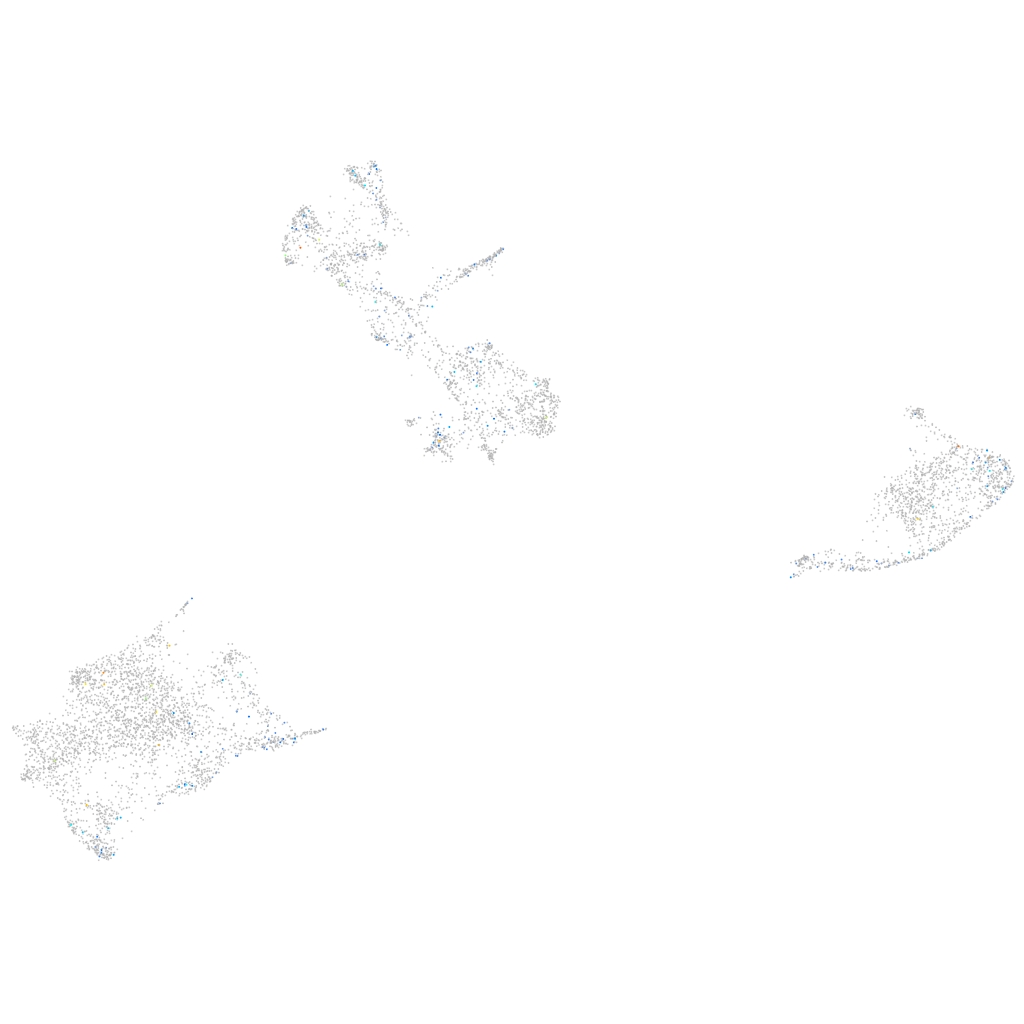
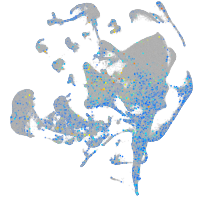
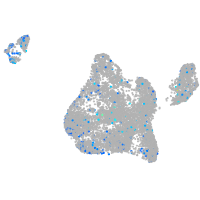
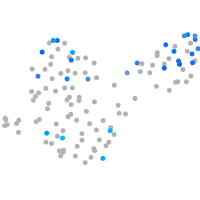
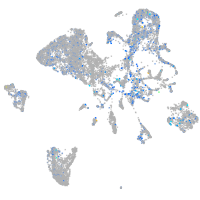
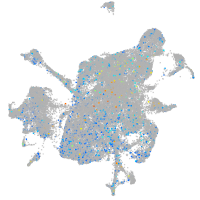
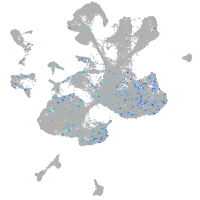
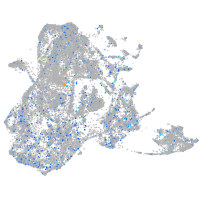
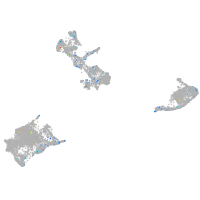
Gene expression UMAP
Display:
Expression
Stage
Other cell groups
all cells
blastomeres
PGCs
endoderm
axial mesoderm
muscle
mural cells /
non-skeletal muscle
mesenchyme
hematopoietic /
vasculature
pronephros
neural
spinal cord / glia
eye
taste / olfactory
otic / lateral line
epidermis
periderm
fin
ionocytes / mucous
pigment cells
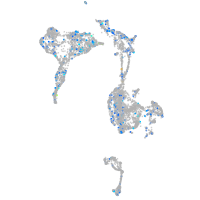
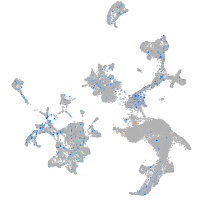
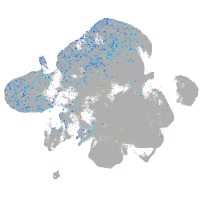
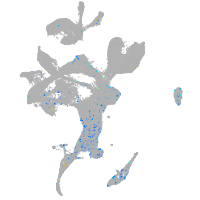
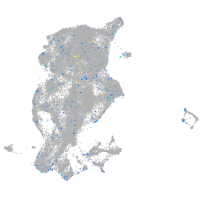
Expression by stage/cluster
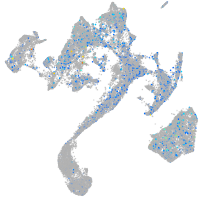
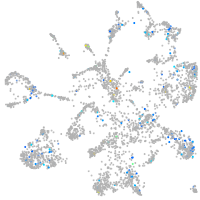
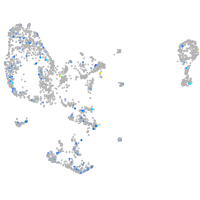
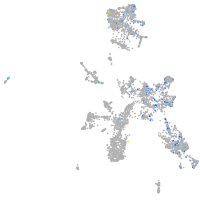
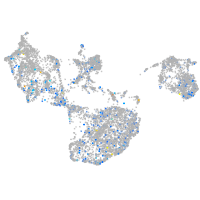
Correlated gene expression
Positive correlation
Negative correlation
Gene
r
Gene
r
AL928835.1
0.192
gch2
-0.042
si:dkey-4e4.1
0.174
hbbe1.3
-0.039
CABZ01065328.1
0.163
krt4
-0.036
CU633478.1
0.150
zgc:110339
-0.034
FP067442.1
0.145
CABZ01021592.1
-0.033
si:dkey-33i11.1
0.129
hbae3
-0.032
tpst2
0.120
actc1b
-0.031
CR450833.1
0.118
sncb
-0.030
adamts2
0.114
pts
-0.029
FO681288.1
0.114
gstp1
-0.029
si:ch73-330k17.3
0.112
si:dkey-251i10.2
-0.028
LOC101883465
0.110
oacyl
-0.028
syt14b
0.109
mylpfa
-0.028
XLOC-034522
0.108
si:dkey-16p21.8
-0.028
LOC110440108
0.106
myhz1.3
-0.026
XLOC-011900
0.106
cotl1
-0.026
FO834799.1
0.104
marcksl1b
-0.026
CR954963.1
0.104
hbbe1.1
-0.025
znf1085
0.103
pvalb2
-0.025
slc39a3.1
0.102
uraha
-0.025
cyp2ad2
0.101
tmsb
-0.025
clcf1
0.101
cyt1l
-0.024
ttc16
0.100
elavl4
-0.023
fn3krp
0.100
pvalb4
-0.023
mical1
0.100
slc22a7a
-0.023
NC-002333.23
0.098
alas1
-0.023
gb:ee300746
0.098
map1aa
-0.022
si:dkey-208b23.5
0.098
atcaya
-0.022
LOC103910224
0.098
golga7ba
-0.022
pih1d3
0.098
neb
-0.022
LOC103910418
0.097
si:dkey-126g1.9
-0.022
si:busm1-163l24.4
0.095
si:ch211-165b10.3
-0.021
GALNT3
0.095
fabp3
-0.021
veph1
0.093
ppfia3
-0.021
tnfrsfa
0.093
cyt1
-0.021