Daniocell
colgalt1 (glial cells / spinal cord)
collagen beta(1-O)galactosyltransferase 1
ZFIN
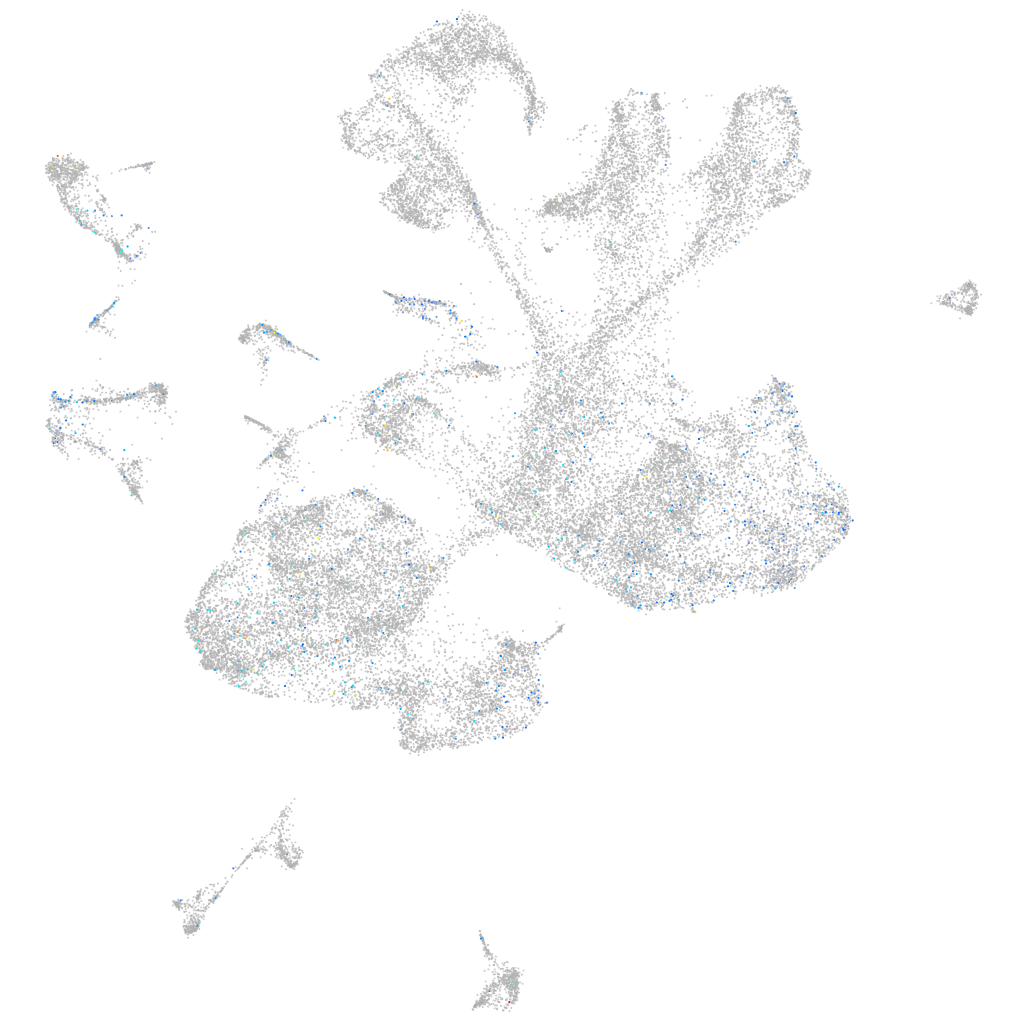
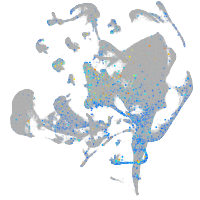
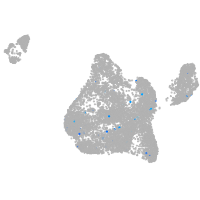
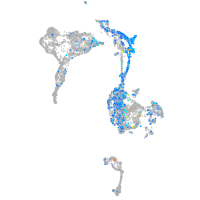
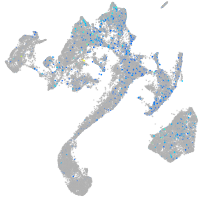
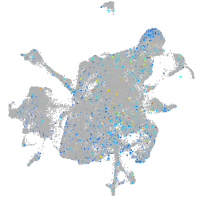
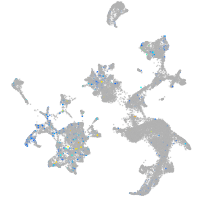
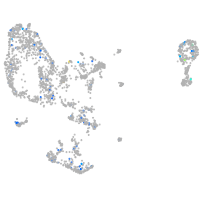
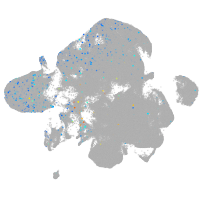
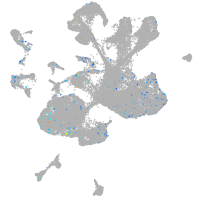
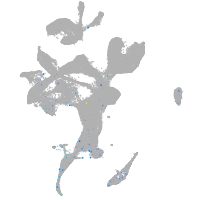
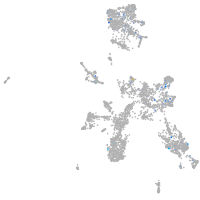
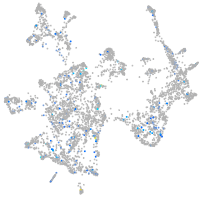
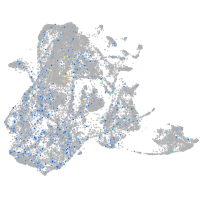
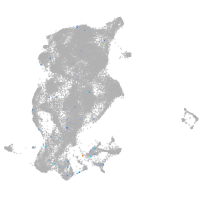
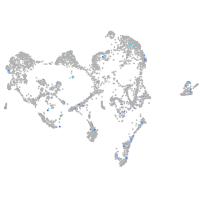
Gene expression UMAP
Display:
Expression
Stage
Other cell groups
all cells
blastomeres
PGCs
endoderm
axial mesoderm
muscle
mural cells /
non-skeletal muscle
mesenchyme
hematopoietic /
vasculature
pronephros
neural
spinal cord / glia
eye
taste / olfactory
otic / lateral line
epidermis
periderm
fin
ionocytes / mucous
pigment cells
Expression by stage/cluster
Correlated gene expression
Positive correlation
Negative correlation
Gene
r
Gene
r
CT737227.1
0.074
elavl3
-0.063
LOC101884619
0.070
myt1b
-0.055
taar10
0.067
rtn1a
-0.053
LOC108180131
0.066
tmsb
-0.052
si:dkey-33b17.3
0.060
stmn1b
-0.046
tnnc1a
0.059
ptmaa
-0.046
CR848717.1
0.058
hmgb3a
-0.045
lamb1a
0.057
tubb2b
-0.045
XLOC-034584
0.057
tuba1c
-0.043
XLOC-013219
0.056
gng3
-0.042
BX323064.2
0.055
nova2
-0.042
XLOC-004681
0.055
sncb
-0.042
HTRA2 (1 of many).11
0.054
hmgb1a
-0.042
krt18a.1
0.052
stxbp1a
-0.041
LOC108179630
0.052
stx1b
-0.041
id1
0.052
h3f3d
-0.041
CR759882.1
0.051
ptmab
-0.041
LOC101882848
0.051
LOC100537384
-0.041
sdc2
0.051
si:ch73-386h18.1
-0.040
fkbp7
0.051
myt1a
-0.040
LOC110440062
0.050
rtn1b
-0.040
si:ch211-225h24.2
0.049
si:dkey-276j7.1
-0.039
wls
0.049
fabp3
-0.039
si:dkey-22h13.3
0.049
syt2a
-0.039
p3h1
0.047
gng2
-0.038
sparc
0.047
elavl4
-0.038
her9
0.047
epb41a
-0.038
sulf1
0.047
tubb5
-0.038
ndnf
0.047
nsg2
-0.038
si:ch211-153b23.4
0.047
cplx2
-0.038
XLOC-042222
0.046
gap43
-0.037
fkbp14
0.046
onecut1
-0.037
CABZ01028298.1
0.045
onecut2
-0.037
CR556712.1
0.045
ywhah
-0.036
LOC110439834
0.045
atcaya
-0.036