Daniocell
clec16a (pigment cells)
C-type lectin domain containing 16A
ZFIN
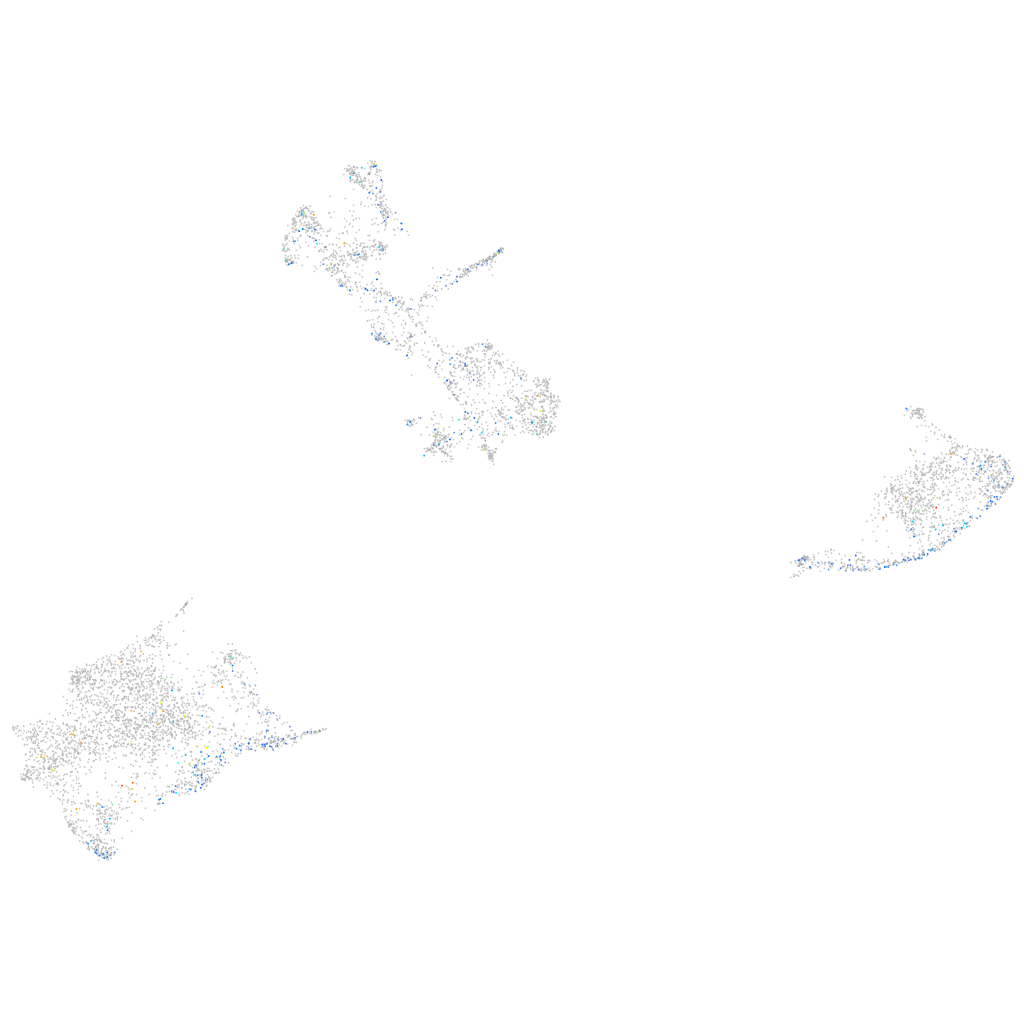
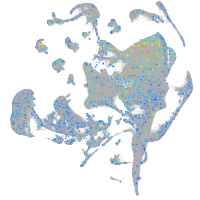
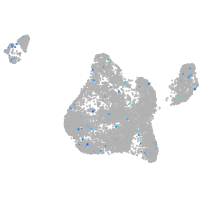
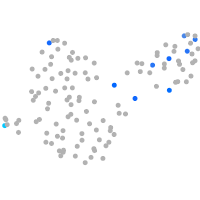
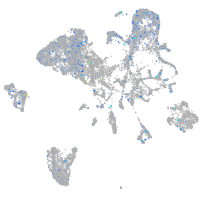
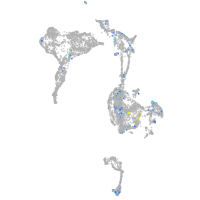
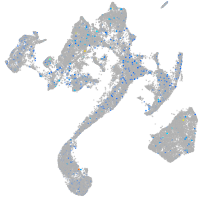
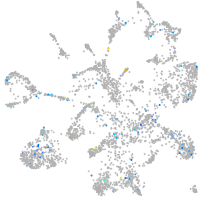
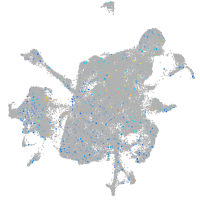
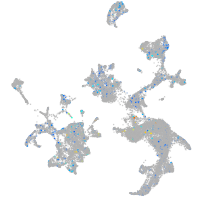
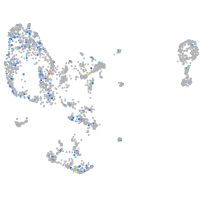
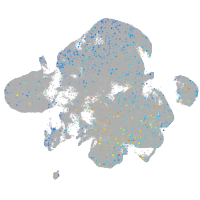
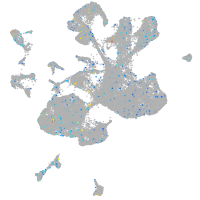
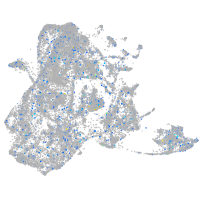
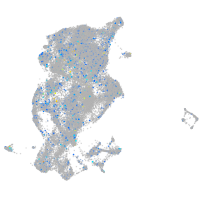
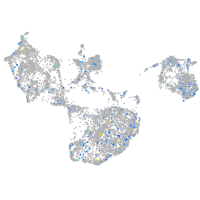
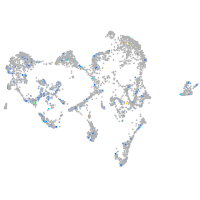
Gene expression UMAP
Display:
Expression
Stage
Other cell groups
all cells
blastomeres
PGCs
endoderm
axial mesoderm
muscle
mural cells /
non-skeletal muscle
mesenchyme
hematopoietic /
vasculature
pronephros
neural
spinal cord / glia
eye
taste / olfactory
otic / lateral line
epidermis
periderm
fin
ionocytes / mucous
pigment cells
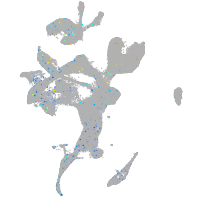
Expression by stage/cluster
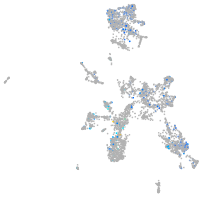
Correlated gene expression
Positive correlation
Negative correlation
Gene
r
Gene
r
BX569790.3
0.144
hbbe1.3
-0.053
gpx9
0.131
hbae1.1
-0.049
snai3
0.126
hbbe1.2
-0.044
si:dkey-219e21.4
0.119
atp2a1
-0.037
LOC103910736
0.116
hbbe1.1
-0.036
AL954696.2
0.112
rps26l
-0.036
BX322787.1
0.101
hbae1.3
-0.035
soat1
0.101
zgc:110339
-0.034
XLOC-031679
0.099
hbae3
-0.032
BX957361.2
0.099
ttn.2
-0.031
LOC101886638
0.098
stmn2a
-0.030
pimr184
0.095
tpma
-0.029
RF00319
0.093
rplp1
-0.029
XLOC-003642
0.093
sncgb
-0.029
si:zfos-943e10.1
0.092
id4
-0.028
pdk3b
0.091
CABZ01021592.1
-0.028
CT573787.1
0.091
rpl38
-0.028
LOC101882787
0.089
rpl17
-0.027
ptprb
0.088
actc1b
-0.026
nansb
0.088
krt4
-0.026
CU459089.1
0.087
rps14
-0.026
krt18a.2
0.086
si:dkey-151g10.6
-0.026
LOC110440152
0.086
rps29
-0.026
kat2a
0.084
tcnbb
-0.026
CU062645.1
0.084
rps8a
-0.026
gad1a
0.084
ptmaa
-0.026
scpp5
0.083
pvalb2
-0.026
LOC101883766
0.082
acta1b
-0.025
slc8a2a
0.081
hbbe2
-0.024
znf1106
0.081
chmp5a
-0.024
crygm2d4
0.080
rbfox1
-0.024
si:ch211-93f2.1
0.080
stmn1b
-0.024
si:dkey-90l8.3
0.079
her4.2
-0.024
BX537120.3
0.079
fam49al
-0.024
cers5
0.079
nova1
-0.023