Daniocell
ckmt2b (glial cells / spinal cord)
"creatine kinase, mitochondrial 2b (sarcomeric)"
ZFIN
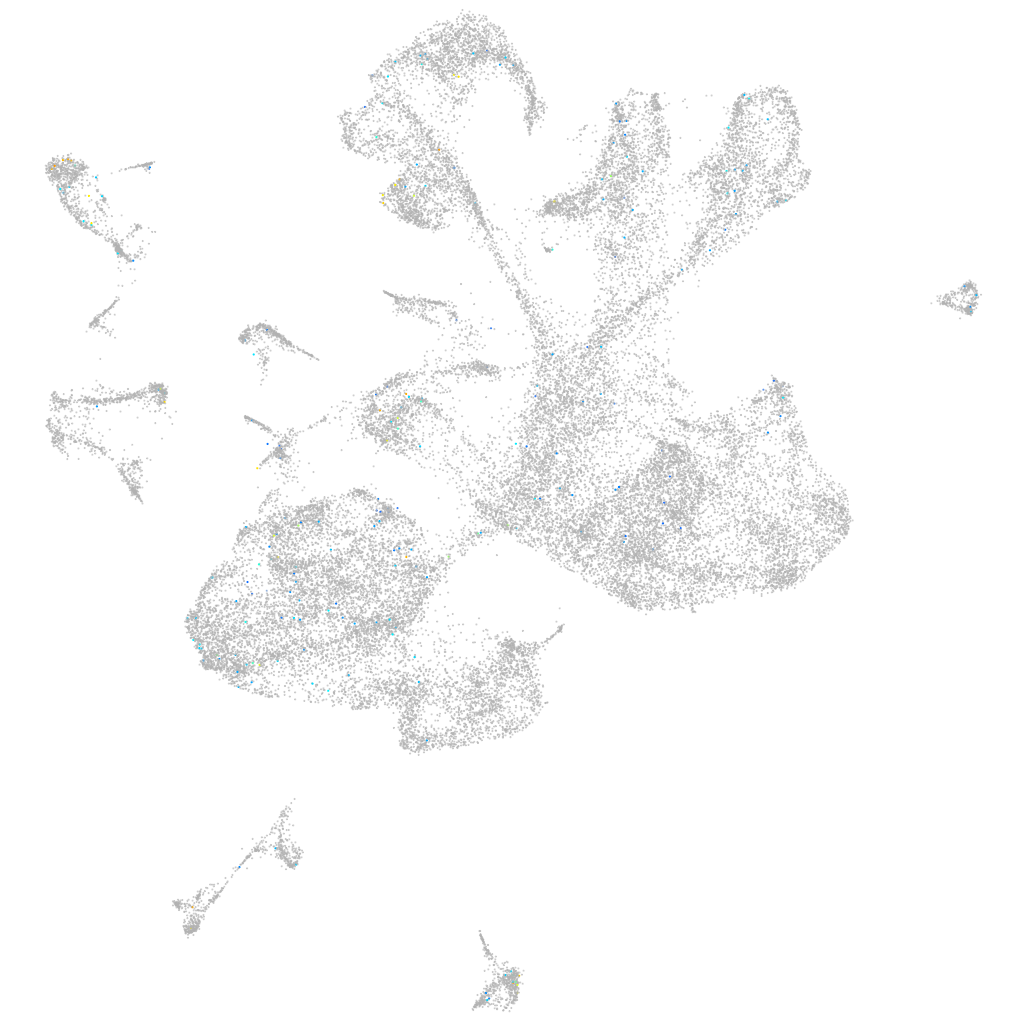
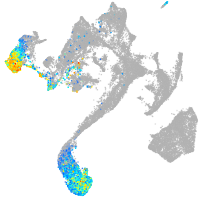
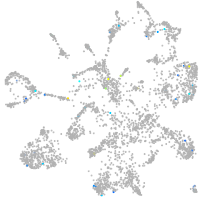
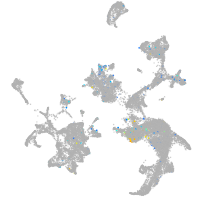
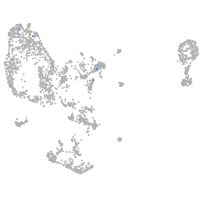
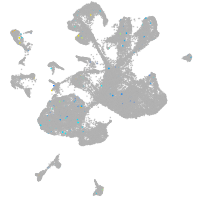
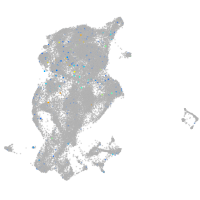
Gene expression UMAP
Display:
Expression
Stage
Other cell groups
all cells
blastomeres
PGCs
endoderm
axial mesoderm
muscle
mural cells /
non-skeletal muscle
mesenchyme
hematopoietic /
vasculature
pronephros
neural
spinal cord / glia
eye
taste / olfactory
otic / lateral line
epidermis
periderm
fin
ionocytes / mucous
pigment cells
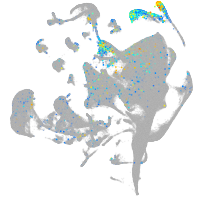
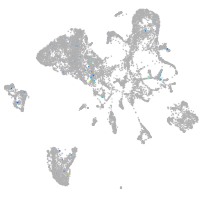
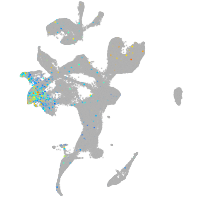
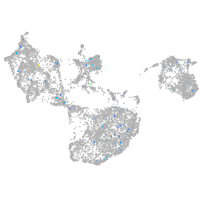
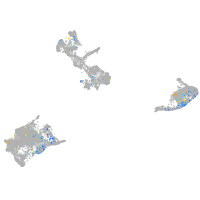
Expression by stage/cluster
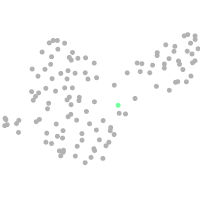
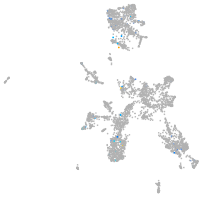
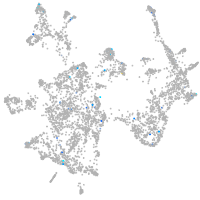
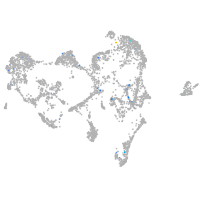
Correlated gene expression
Positive correlation
Negative correlation
Gene
r
Gene
r
ponzr10
0.086
hmga1a
-0.047
opn1lw1
0.080
eef2b
-0.047
LOC560461
0.077
seta
-0.047
pvalb2
0.071
rpl32
-0.046
pvalb1
0.067
tubb2b
-0.046
si:ch73-138i16.1
0.067
rps3
-0.045
LO018564.1
0.065
hnrnpaba
-0.044
apoa2
0.065
khdrbs1a
-0.044
mylz3
0.064
rpl15
-0.043
muc5.1
0.063
h2afvb
-0.042
LOC110438475
0.063
hnrnpa0l
-0.042
si:ch1073-15f19.2
0.063
hsp90ab1
-0.042
actc1b
0.061
si:ch211-222l21.1
-0.042
si:ch73-269m23.5
0.061
ran
-0.041
ela2l
0.058
si:ch211-288g17.3
-0.041
prss59.2
0.056
rpl7a
-0.041
LOC103910907
0.056
rps5
-0.040
mymk
0.055
rpl23a
-0.040
mylpfa
0.055
cirbpb
-0.040
CELA1 (1 of many)
0.054
rps9
-0.040
meox2b
0.053
ddx39ab
-0.040
zgc:136908
0.052
hmgn6
-0.039
CU633478.1
0.052
rps7
-0.039
CABZ01064405.1
0.052
hmgb2a
-0.039
slc5a8
0.052
rpl5a
-0.039
CU651662.1
0.051
rps16
-0.039
mylpfb
0.051
hmgb2b
-0.039
gngt2b
0.051
eif3f
-0.038
tgm1l4
0.051
rpl10a
-0.038
rs1b
0.050
h3f3d
-0.038
si:ch73-359m17.9
0.050
XLOC-003689
-0.038
nme2b.2
0.050
nucks1a
-0.038
si:dkey-7c18.24
0.049
eif3ba
-0.037
tnnt3b
0.049
rps12
-0.037
sycn.2
0.048
rack1
-0.037