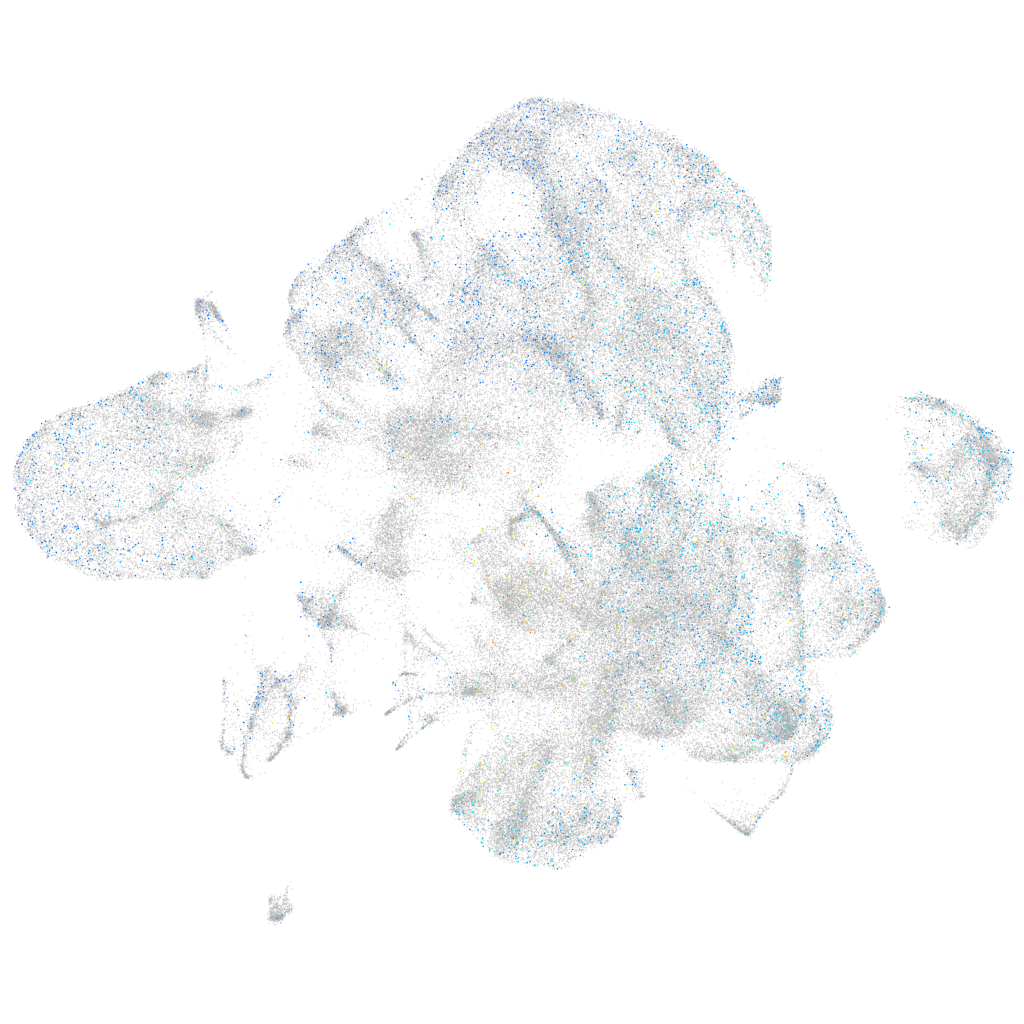
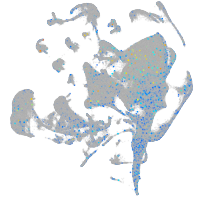
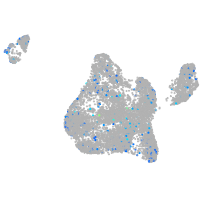
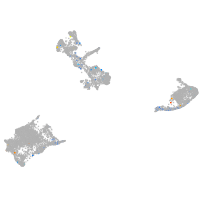
cdkn1a interacting zinc finger protein 1a
ZFIN 
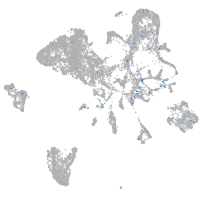
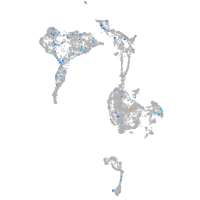
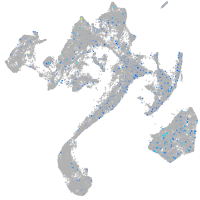
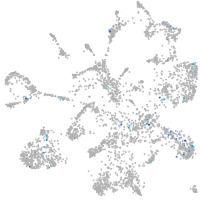
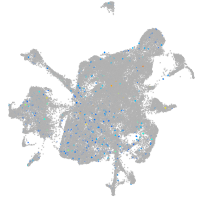
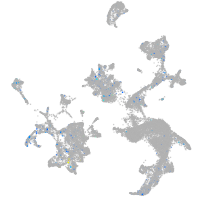
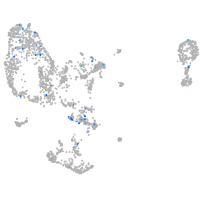
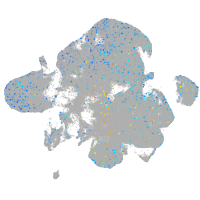
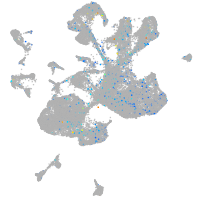
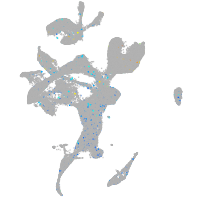
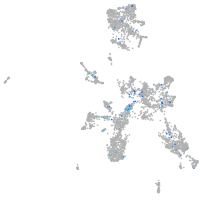
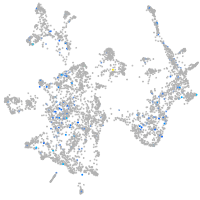
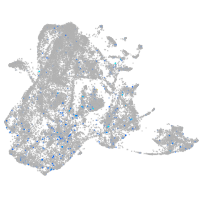
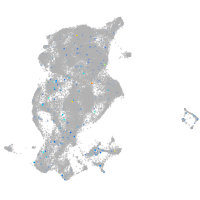
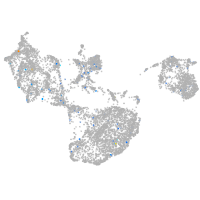
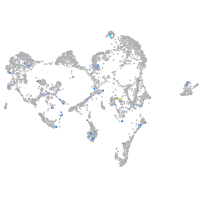
Expression by stage/cluster


Correlated gene expression


| Positive correlation | Negative correlation | ||
| Gene | r | Gene | r |
| elavl3 | 0.053 | selenoh | -0.021 |
| sox11b | 0.053 | apoa2 | -0.020 |
| chd4a | 0.053 | apoa1b | -0.018 |
| myt1b | 0.053 | pcna | -0.018 |
| myt1a | 0.053 | prss1 | -0.018 |
| hnrnpaba | 0.051 | prss59.2 | -0.017 |
| hnrnpa0a | 0.049 | gngt2b | -0.017 |
| nova2 | 0.048 | fen1 | -0.017 |
| tmpob | 0.047 | nutf2l | -0.016 |
| cirbpb | 0.047 | ctrb1 | -0.016 |
| smarce1 | 0.047 | edil3a | -0.016 |
| tmeff1b | 0.046 | fosab | -0.016 |
| si:dkey-56m19.5 | 0.046 | h1fx | -0.016 |
| pbx4 | 0.046 | npm1a | -0.015 |
| dlb | 0.045 | CELA1 (1 of many) | -0.015 |
| zswim5 | 0.045 | banf1 | -0.015 |
| khdrbs1a | 0.045 | prss59.1 | -0.015 |
| si:ch211-288g17.3 | 0.044 | pmp22a | -0.015 |
| ddx5 | 0.044 | glula | -0.015 |
| hmgb3a | 0.044 | si:dkey-44g23.5 | -0.015 |
| tp53inp2 | 0.044 | eif4ebp3 | -0.015 |
| tubb5 | 0.043 | stmn1a | -0.015 |
| ctnnbip1 | 0.043 | mtbl | -0.015 |
| top2b | 0.042 | tmsb1 | -0.014 |
| tuba1a | 0.042 | dnph1 | -0.014 |
| hnrnpa0l | 0.042 | si:ch211-156b7.4 | -0.014 |
| ptmab | 0.042 | nop58 | -0.014 |
| fscn1a | 0.042 | dut | -0.014 |
| si:ch211-222l21.1 | 0.041 | snu13b | -0.014 |
| nhlh2 | 0.041 | ela2l | -0.014 |
| scrt2 | 0.041 | krt17 | -0.014 |
| ube2g1a | 0.041 | npas4a | -0.014 |
| insm1a | 0.041 | fabp2 | -0.014 |
| celf3a | 0.041 | dap1b | -0.014 |
| smarca4a | 0.041 | nupr1a | -0.013 |


