Daniocell
cib1 (blastomeres)
calcium and integrin binding 1 (calmyrin)
ZFIN
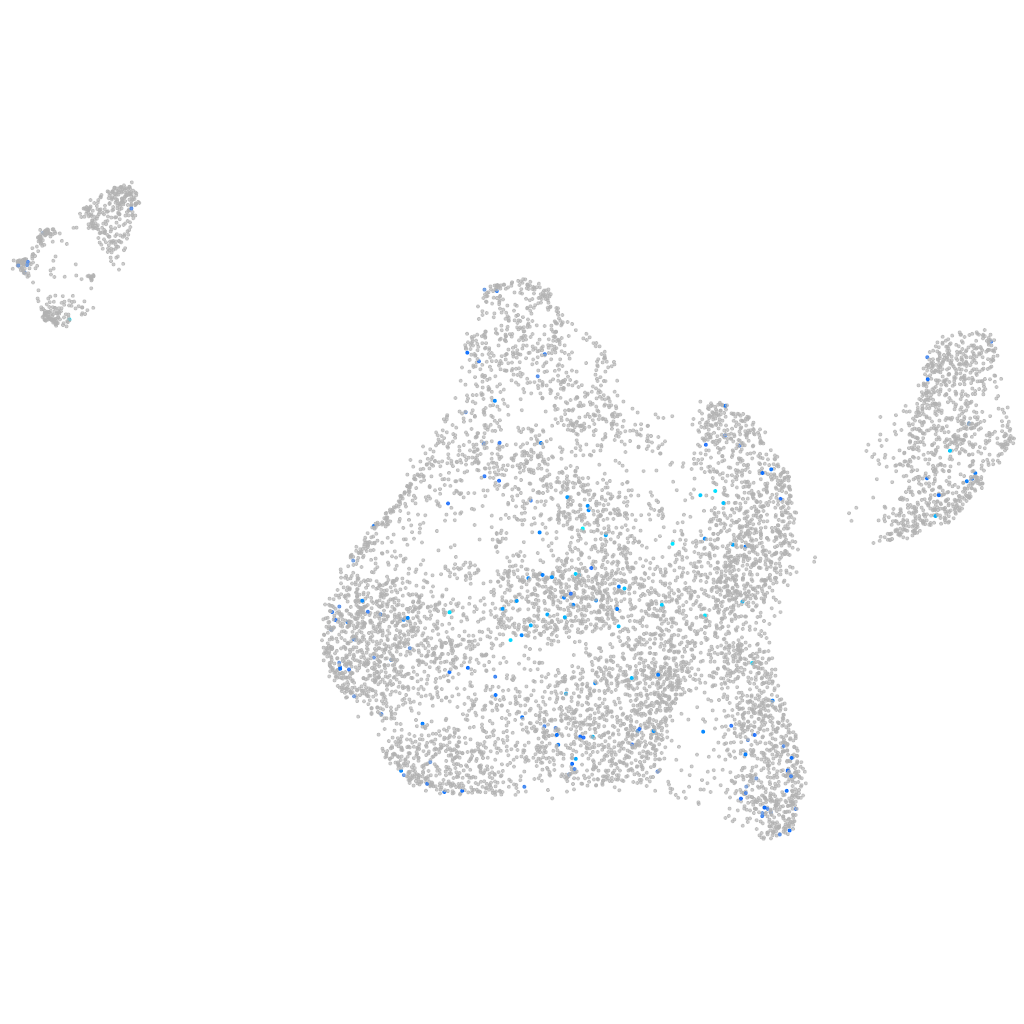
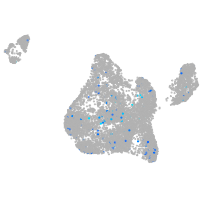
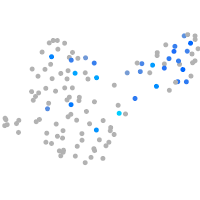
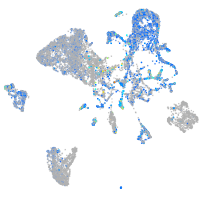
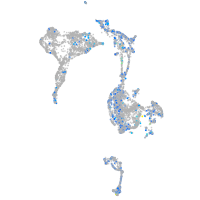
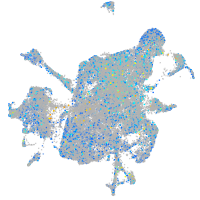
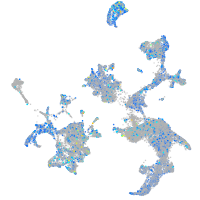
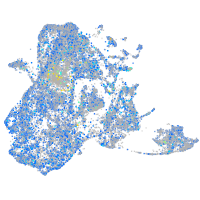
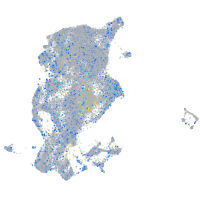
Gene expression UMAP
Display:
Expression
Stage
Other cell groups
all cells
blastomeres
PGCs
endoderm
axial mesoderm
muscle
mural cells /
non-skeletal muscle
mesenchyme
hematopoietic /
vasculature
pronephros
neural
spinal cord / glia
eye
taste / olfactory
otic / lateral line
epidermis
periderm
fin
ionocytes / mucous
pigment cells
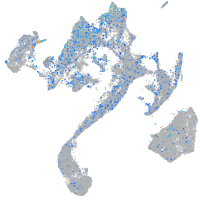
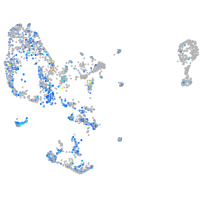
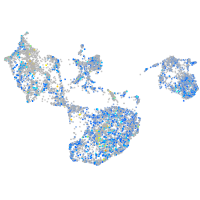
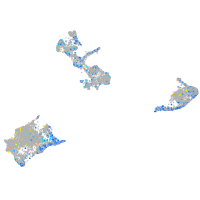
Expression by stage/cluster
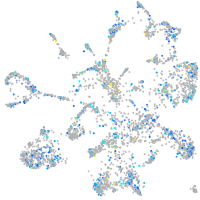
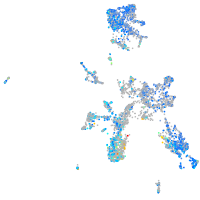
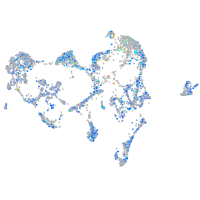
Correlated gene expression
Positive correlation
Negative correlation
Gene
r
Gene
r
LOC101885053
0.155
cd2bp2
-0.038
LOC103911318
0.138
pho
-0.036
LOC100537813
0.137
gtf2a1
-0.035
BX294177.1
0.134
hgs
-0.035
ret
0.114
NC-002333.4
-0.035
CR925723.3
0.114
snx5
-0.034
gad1b
0.104
ap1s3b
-0.033
FO704758.1
0.103
dvl3a
-0.033
CU856343.1
0.102
ppp4r2a
-0.033
zgc:113307
0.100
si:dkey-68o6.5
-0.032
isl1l
0.100
h1m
-0.032
si:ch1073-335m2.2
0.098
slc16a3
-0.032
wnt9b
0.096
cldnd
-0.032
si:dkey-17m8.2
0.096
arhgef1b
-0.031
LOC101884520
0.095
ptpn2b
-0.031
si:dkey-1c7.2
0.094
lamp2
-0.031
nkx2.9
0.093
emc2
-0.031
si:dkey-43k4.3
0.090
jpt1b
-0.031
zgc:123299
0.089
ahcyl2
-0.031
CT025748.1
0.088
trim44
-0.030
psd2
0.088
ctsba
-0.030
FO905027.1
0.087
si:ch211-161h7.4
-0.030
si:dkeyp-118a3.2
0.087
cdc6
-0.030
myl2b
0.087
rhogc
-0.030
BX890559.1
0.087
fmr1
-0.030
waif2
0.086
ehmt1b
-0.029
si:ch211-117l17.4
0.085
ska2
-0.029
LOC100004033
0.085
syncripl
-0.029
BX470229.2
0.085
ssbp3a
-0.029
rxfp3.2b
0.085
otud4
-0.028
CR762475.1
0.085
fbxo32
-0.028
aqp10a
0.081
nanog
-0.028
si:ch211-207l14.1
0.081
msl1b
-0.028
XLOC-037221
0.080
harbi1
-0.028
soul5l
0.080
nudt3a
-0.028