Daniocell
chchd4b (glial cells / spinal cord)
coiled-coil-helix-coiled-coil-helix domain containing 4b
ZFIN
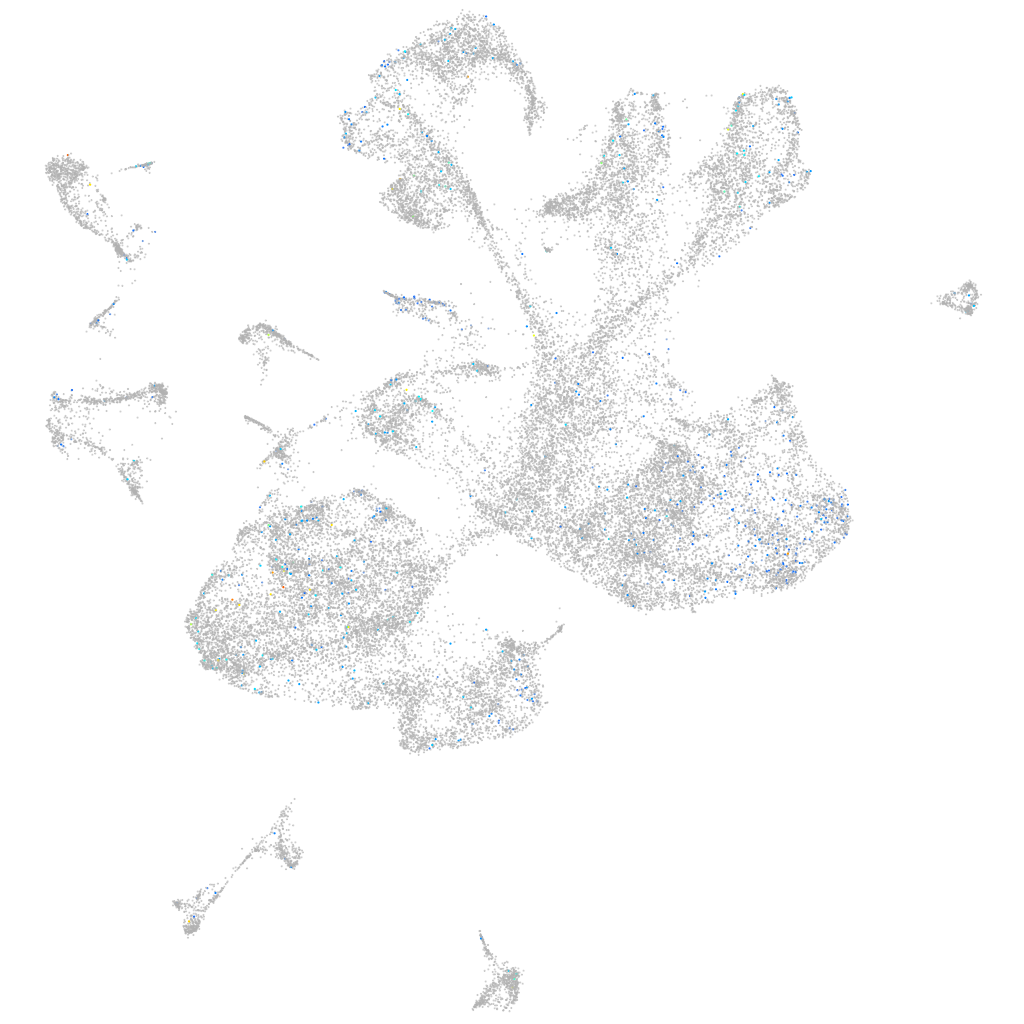
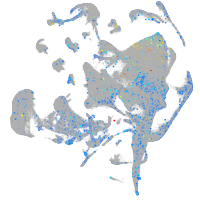
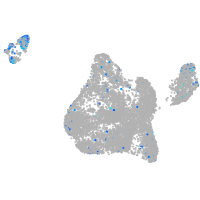
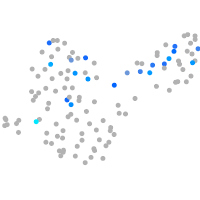
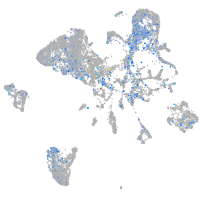
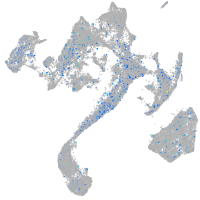
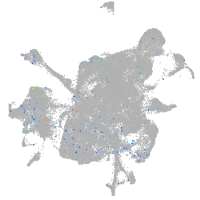
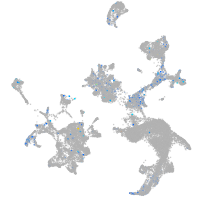
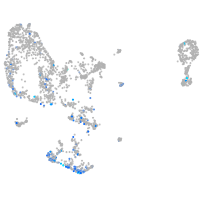
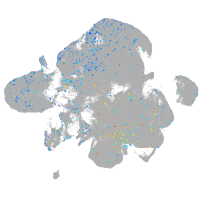
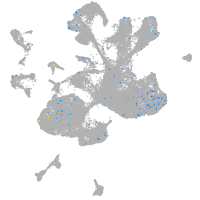
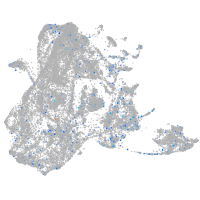
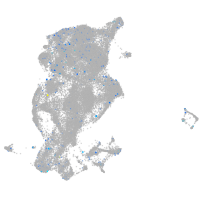
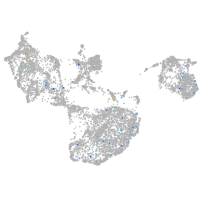
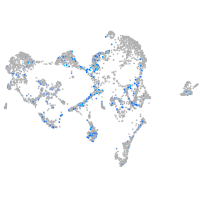
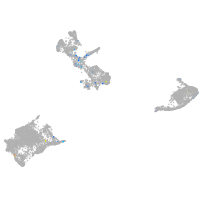
Gene expression UMAP
Display:
Expression
Stage
Other cell groups
all cells
blastomeres
PGCs
endoderm
axial mesoderm
muscle
mural cells /
non-skeletal muscle
mesenchyme
hematopoietic /
vasculature
pronephros
neural
spinal cord / glia
eye
taste / olfactory
otic / lateral line
epidermis
periderm
fin
ionocytes / mucous
pigment cells
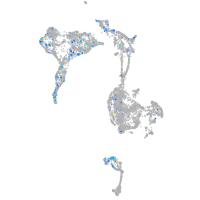
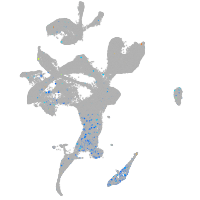
Expression by stage/cluster
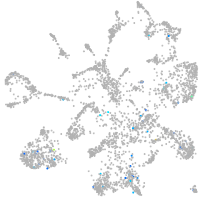
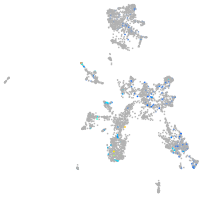
Correlated gene expression
Positive correlation
Negative correlation
Gene
r
Gene
r
LOC110437791
0.077
si:ch211-57n23.4
-0.037
LOC101882203
0.067
si:ch73-21g5.7
-0.037
BX914214.2
0.064
LOC798783
-0.032
CABZ01056054.1
0.059
si:dkey-42i9.4
-0.031
slc26a6l
0.057
si:ch73-386h18.1
-0.031
XLOC-034525
0.050
LOC101882472
-0.031
vav3a
0.050
sox11b
-0.031
c1qbp
0.049
tp53inp2
-0.030
tnfsf10l3
0.049
gadd45gb.1
-0.029
si:ch73-236c18.2.1
0.048
fabp3
-0.029
epx
0.047
marcksl1b
-0.029
zhx2b
0.047
cdkn1ca
-0.029
LOC110438862
0.046
efcc1
-0.027
ldhba
0.045
neurod4
-0.027
svopb
0.045
tmsb4x
-0.026
or108-2
0.045
dlb
-0.026
LOC101885599
0.045
ebf2
-0.025
COX5B
0.044
acvr2ba
-0.025
gpia
0.043
cep131
-0.025
calm3a
0.043
myt1b
-0.025
XLOC-036754
0.042
notch1a
-0.024
sh2d5
0.042
rnf165a
-0.024
gapdhs
0.042
her13
-0.023
CR388195.1
0.042
pou3f3b
-0.023
ppifb
0.041
lrrn1
-0.023
tomm20a
0.041
vim
-0.022
chchd10
0.041
mxi1
-0.022
snu13b
0.041
si:ch211-222l21.1
-0.022
adi1
0.040
hapln1a
-0.022
atp5mc3b
0.040
rps29
-0.022
cnbpb
0.040
nhlh2
-0.022
cdkn1a
0.040
elavl3
-0.021
BX294661.1
0.040
ebf3a
-0.021
mpc1
0.040
zgc:110796
-0.021
atp1b1b
0.039
cirbpb
-0.021