
ceramide synthase 5
ZFIN 
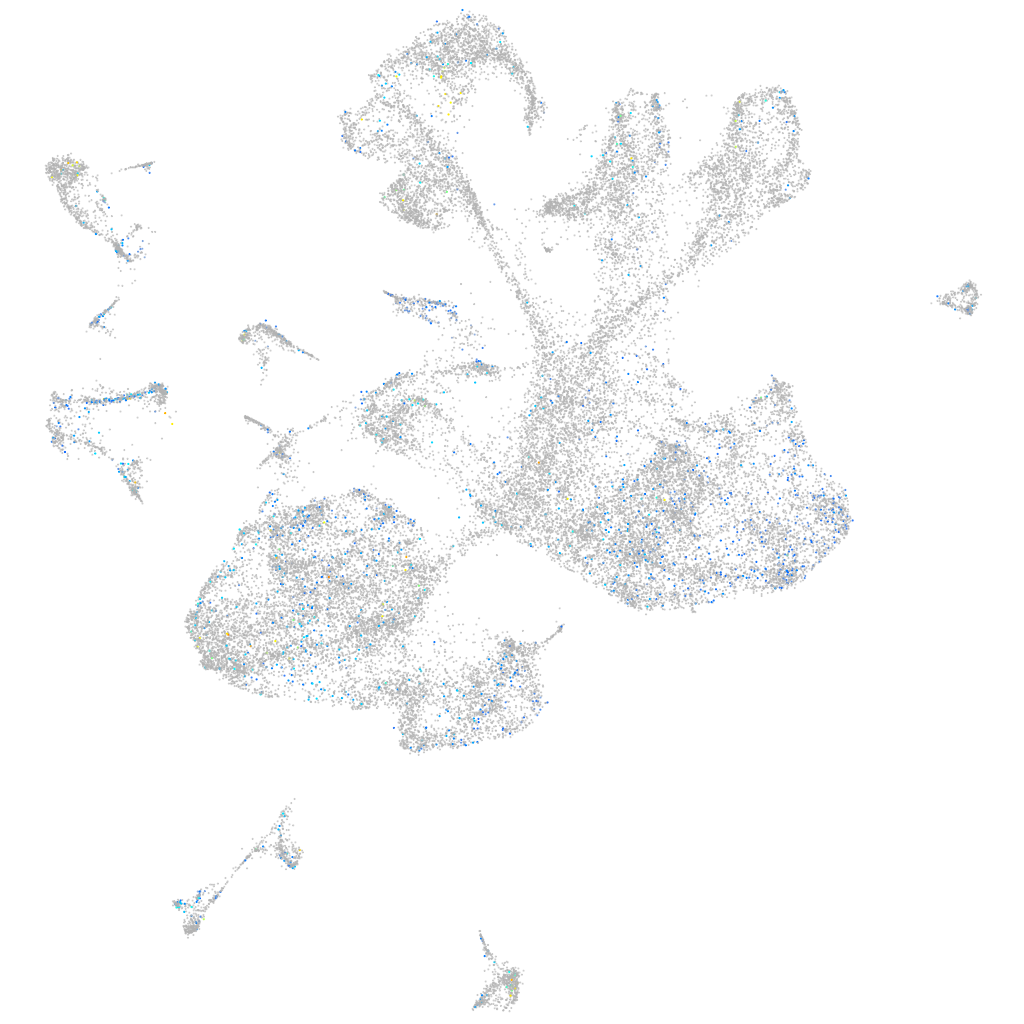
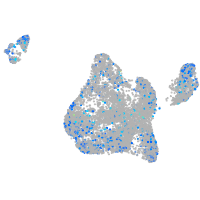
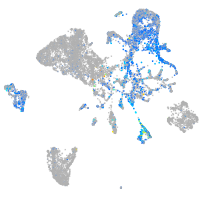
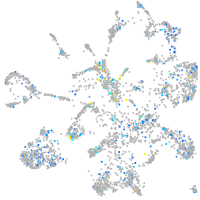
Gene expression UMAP


Expression by stage/cluster
Correlated gene expression
| Positive correlation | Negative correlation | ||
| Gene | r | Gene | r |
| fxyd1 | 0.064 | elavl3 | -0.062 |
| trabd2b | 0.063 | myt1b | -0.058 |
| clu | 0.061 | ptmab | -0.054 |
| lcn15 | 0.061 | tp53inp2 | -0.054 |
| ctgfa | 0.060 | sox11b | -0.050 |
| scinlb | 0.059 | myt1a | -0.049 |
| npr3 | 0.059 | si:ch73-1a9.3 | -0.048 |
| BX908782.3 | 0.059 | hmgb3a | -0.045 |
| slit1b | 0.058 | hmgn6 | -0.045 |
| myl9a | 0.058 | LOC100537384 | -0.045 |
| col9a3 | 0.057 | ebf2 | -0.045 |
| shhb | 0.057 | dlb | -0.044 |
| anxa13 | 0.057 | si:ch73-386h18.1 | -0.044 |
| XLOC-031177 | 0.057 | rtn1a | -0.044 |
| spon2a | 0.055 | tmsb | -0.044 |
| her9 | 0.054 | chd4a | -0.043 |
| fosab | 0.053 | nhlh2 | -0.042 |
| arxa | 0.052 | nova2 | -0.042 |
| cd63 | 0.052 | LOC798783 | -0.042 |
| cyr61l2 | 0.051 | h3f3d | -0.042 |
| slit2 | 0.051 | scrt2 | -0.041 |
| LOC101885535 | 0.051 | pik3r3b | -0.041 |
| s100b | 0.051 | ebf3a | -0.040 |
| anxa3b | 0.051 | epb41a | -0.038 |
| ptgs2a | 0.051 | si:ch73-21g5.7 | -0.038 |
| sulf1 | 0.050 | notch1a | -0.038 |
| wnt4a | 0.050 | tmeff1b | -0.037 |
| anxa4 | 0.050 | srrm4 | -0.037 |
| shha | 0.050 | zfhx3 | -0.037 |
| col2a1b | 0.049 | hoxb9a | -0.036 |
| zfp36l1a | 0.049 | lhx1a | -0.036 |
| spon1b | 0.049 | zc4h2 | -0.036 |
| col2a1a | 0.049 | gadd45gb.1 | -0.036 |
| hapln1b | 0.049 | neurod4 | -0.035 |
| XLOC-044191 | 0.049 | thsd7aa | -0.035 |