
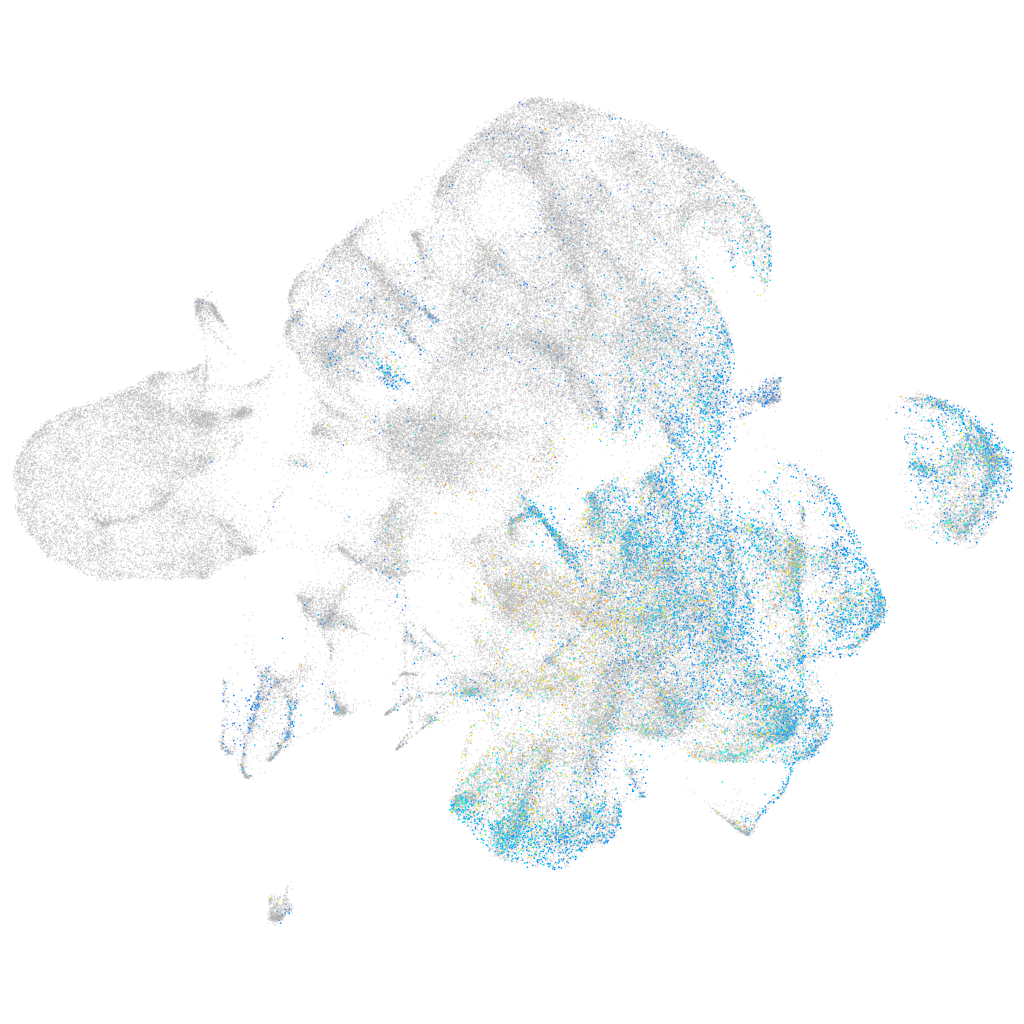
"cugbp, Elav-like family member 3b"
ZFIN 
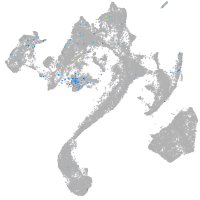
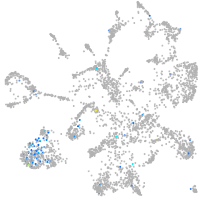
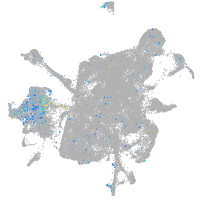
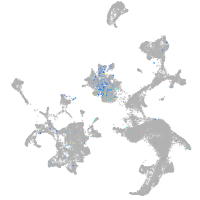
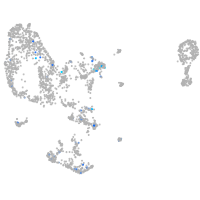
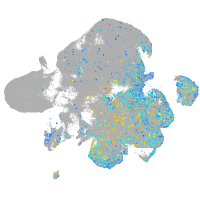
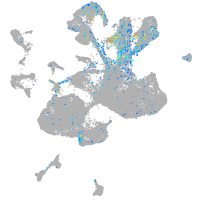
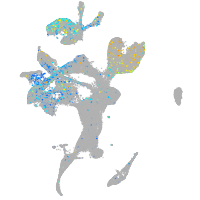
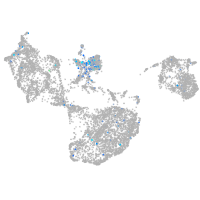
Gene expression UMAP


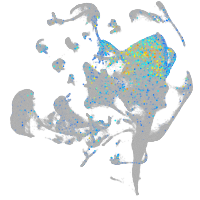


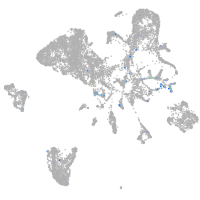
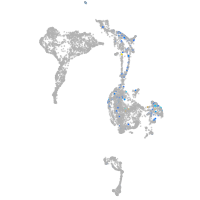
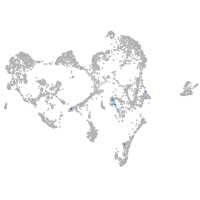
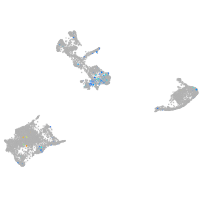
Expression by stage/cluster
Correlated gene expression
| Positive correlation | Negative correlation | ||
| Gene | r | Gene | r |
| stmn1b | 0.221 | hmgb2a | -0.188 |
| elavl3 | 0.219 | id1 | -0.169 |
| rtn1a | 0.187 | pcna | -0.168 |
| zc4h2 | 0.185 | anp32b | -0.147 |
| ptmaa | 0.185 | ranbp1 | -0.145 |
| ywhah | 0.184 | banf1 | -0.145 |
| sox4a | 0.181 | stmn1a | -0.144 |
| tuba1c | 0.181 | npm1a | -0.144 |
| hmgb3a | 0.177 | selenoh | -0.144 |
| h2afx1 | 0.177 | ccnd1 | -0.142 |
| gng2 | 0.176 | nop58 | -0.140 |
| tmsb | 0.175 | chaf1a | -0.140 |
| ckbb | 0.175 | msna | -0.140 |
| si:dkey-276j7.1 | 0.173 | snu13b | -0.137 |
| fez1 | 0.173 | dkc1 | -0.137 |
| gng3 | 0.172 | tuba8l | -0.136 |
| celf3a | 0.171 | mki67 | -0.136 |
| jpt1b | 0.167 | lig1 | -0.134 |
| nova2 | 0.166 | rrm1 | -0.133 |
| celf2 | 0.166 | fen1 | -0.131 |
| tubb5 | 0.165 | nop56 | -0.130 |
| tmeff1b | 0.164 | si:ch73-281n10.2 | -0.129 |
| gpm6aa | 0.162 | rpa3 | -0.129 |
| myt1a | 0.161 | fbl | -0.129 |
| dpysl2b | 0.154 | mcm6 | -0.129 |
| fscn1a | 0.153 | nutf2l | -0.128 |
| gpm6ab | 0.153 | cdca7b | -0.127 |
| myt1b | 0.152 | dut | -0.127 |
| dpysl3 | 0.152 | sox19a | -0.125 |
| kdm6bb | 0.149 | nasp | -0.125 |
| mllt11 | 0.148 | lbr | -0.123 |
| chd4a | 0.148 | tuba8l4 | -0.123 |
| ube2d4 | 0.145 | akap12b | -0.123 |
| gatad2b | 0.145 | sox3 | -0.123 |
| csdc2a | 0.145 | dek | -0.123 |