Daniocell
cdip1 (epidermis)
cell death-inducing p53 target 1
ZFIN
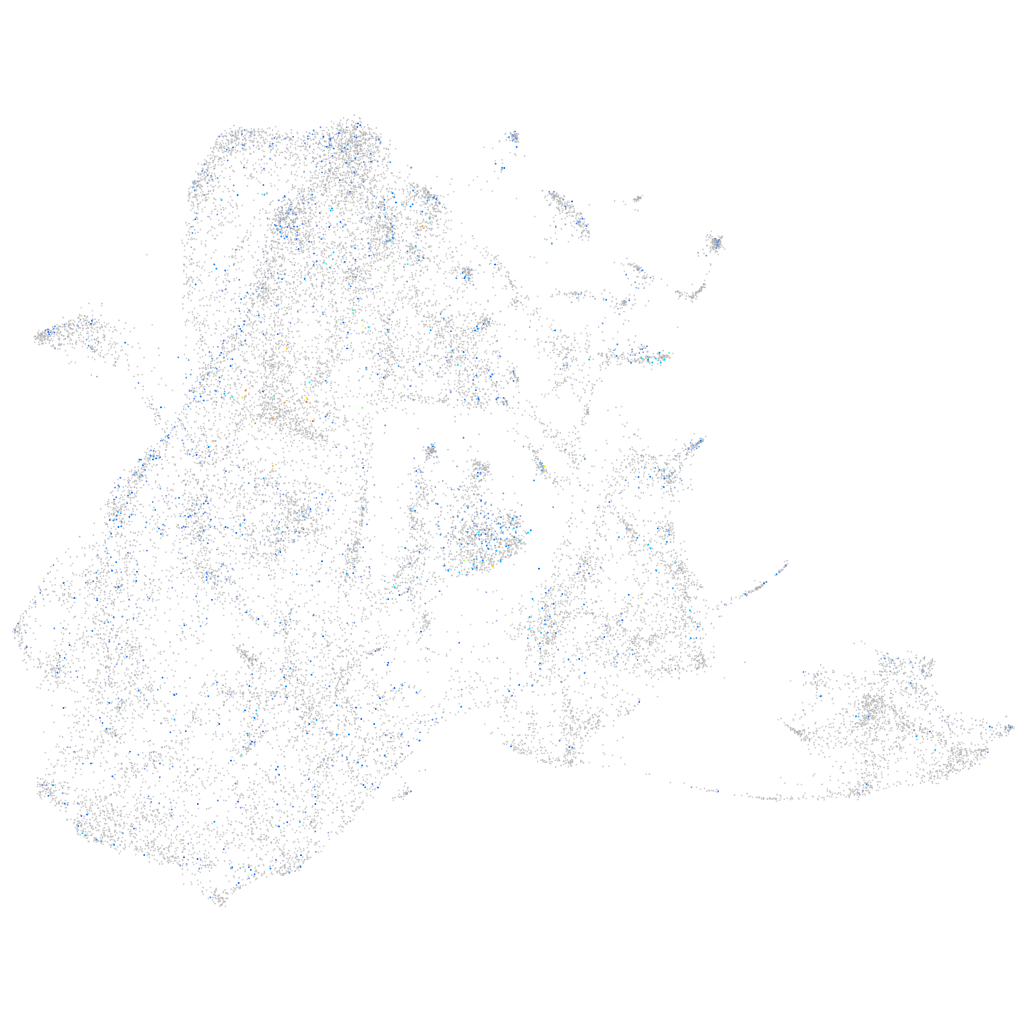
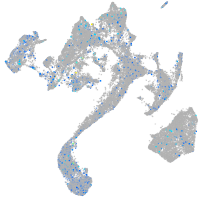
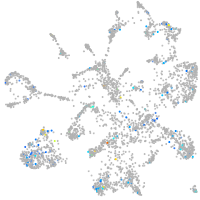
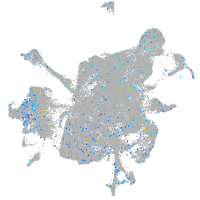
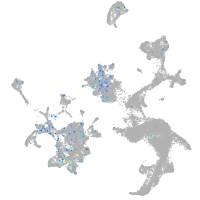
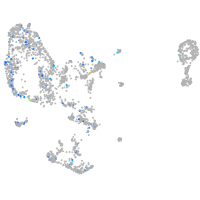
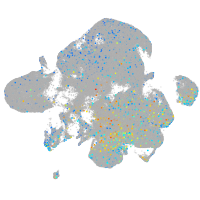
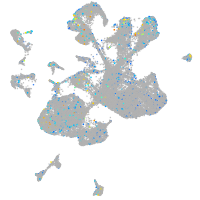
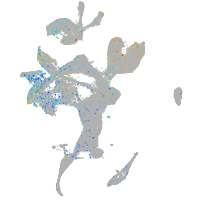
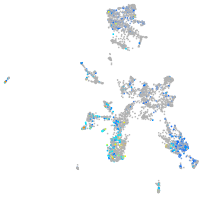
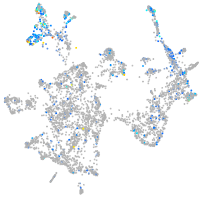
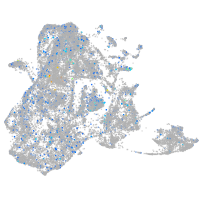
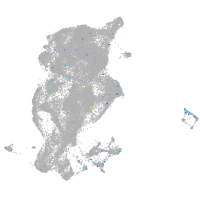
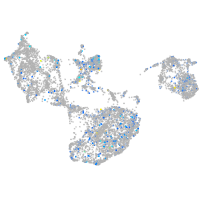
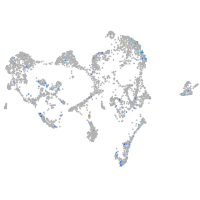
Gene expression UMAP
Display:
Expression
Stage
Other cell groups
all cells
blastomeres
PGCs
endoderm
axial mesoderm
muscle
mural cells /
non-skeletal muscle
mesenchyme
hematopoietic /
vasculature
pronephros
neural
spinal cord / glia
eye
taste / olfactory
otic / lateral line
epidermis
periderm
fin
ionocytes / mucous
pigment cells
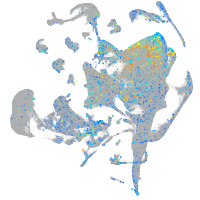
Expression by stage/cluster
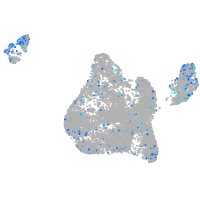
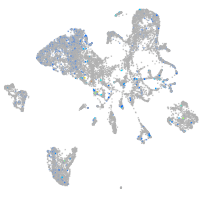
Correlated gene expression
Positive correlation
Negative correlation
Gene
r
Gene
r
ft2
0.097
krt92
-0.043
si:dkey-61f9.1
0.084
nhp2
-0.038
atoh1c
0.076
ANXA1 (1 of many)
-0.037
CR388079.2
0.069
anxa1b
-0.036
LOC108179500
0.068
pitx1
-0.036
BX293991.1
0.068
dhrs13a.2
-0.035
si:ch211-232d10.1
0.067
ponzr5
-0.035
gpr174
0.067
krt1-19d
-0.035
BX548032.1
0.063
rps27.1
-0.035
FP102169.1
0.062
si:ch211-157c3.4
-0.035
col11a1a
0.061
evplb
-0.034
VSTM2B
0.059
zgc:153665
-0.034
XLOC-026774
0.059
lye
-0.033
si:dkey-61f9.2
0.059
rps19
-0.033
col1a2
0.058
evpla
-0.033
col1a1b
0.058
scel
-0.033
hepacam2
0.058
agr1
-0.033
si:ch73-208h1.1
0.057
cldne
-0.033
LOC101884879
0.057
cldnb
-0.033
bsk146
0.057
rpl26
-0.032
zgc:153920
0.056
rps26l
-0.032
tuba1c
0.056
rpl21
-0.032
FP015866.1
0.056
snrpd1
-0.032
LOC108182396
0.056
hsd17b12a
-0.032
si:ch73-359m17.5
0.055
si:ch73-204p21.2
-0.032
col4a5
0.055
stard14
-0.031
btr33
0.055
nop56
-0.031
col1a1a
0.055
rps7
-0.031
LOC108191020
0.054
snrpf
-0.031
col2a1b
0.054
ran
-0.031
LOC101883916
0.054
si:dkey-151g10.6
-0.031
LO018605.2
0.054
rps13
-0.030
bdh2
0.053
eef1a1l1
-0.030
si:ch211-234p6.9
0.053
nutf2l
-0.030
elavl4
0.053
capn9
-0.030