Daniocell
cdh17 (neural)
"cadherin 17, LI cadherin (liver-intestine)"
ZFIN
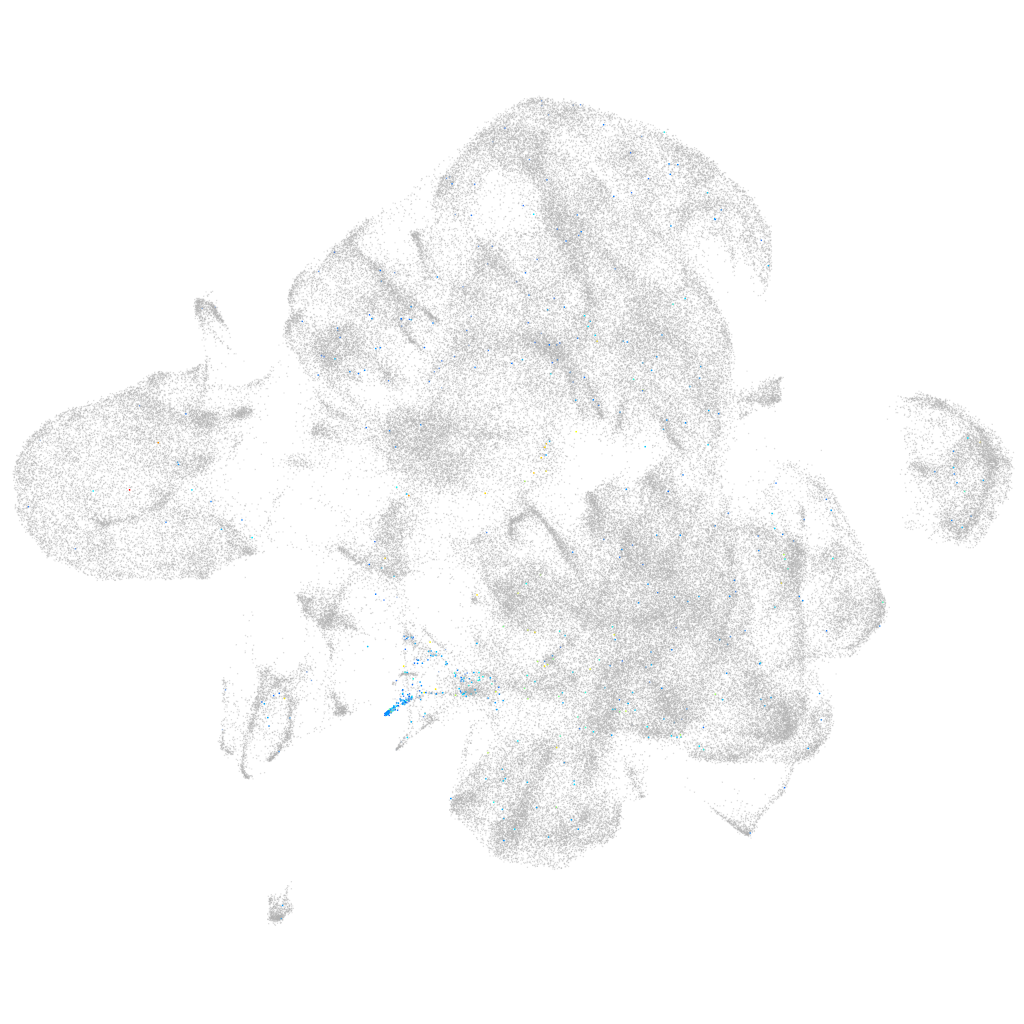
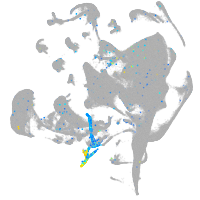
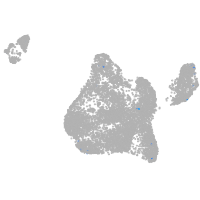
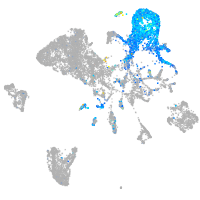
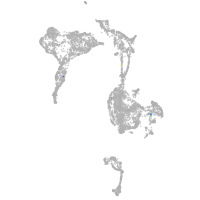
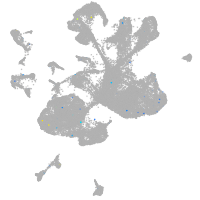
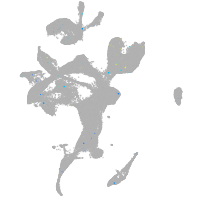
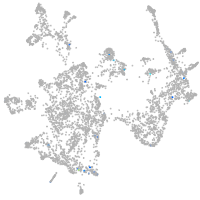
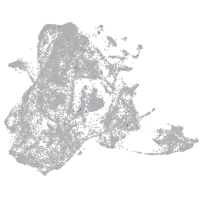
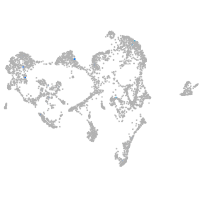
Gene expression UMAP
Display:
Expression
Stage
Other cell groups
all cells
blastomeres
PGCs
endoderm
axial mesoderm
muscle
mural cells /
non-skeletal muscle
mesenchyme
hematopoietic /
vasculature
pronephros
neural
spinal cord / glia
eye
taste / olfactory
otic / lateral line
epidermis
periderm
fin
ionocytes / mucous
pigment cells
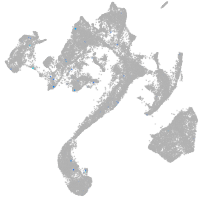
Expression by stage/cluster
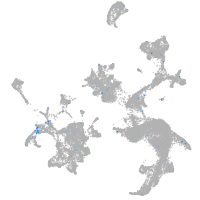
Correlated gene expression
Positive correlation
Negative correlation
Gene
r
Gene
r
ace2
0.262
ptmab
-0.051
si:ch211-113d11.6
0.253
si:ch211-222l21.1
-0.050
si:dkeyp-73b11.8
0.249
h3f3d
-0.042
tm4sf4
0.244
hnrnpaba
-0.041
zgc:158846
0.243
tubb2b
-0.040
plac8.1
0.243
si:ch211-288g17.3
-0.039
zgc:77748
0.240
cirbpb
-0.039
cldn15la
0.239
khdrbs1a
-0.037
zgc:153968
0.239
hmga1a
-0.037
si:dkey-36i7.3
0.234
marcksb
-0.036
zgc:172079
0.234
seta
-0.036
anxa2b
0.232
hnrnpa0b
-0.035
vil1
0.232
hmgn6
-0.035
si:ch211-133l5.7
0.228
cirbpa
-0.034
apoa4b.2
0.226
marcksl1b
-0.034
ugt1a7
0.225
hnrnpabb
-0.032
s100a10a
0.220
syncrip
-0.032
neu3.3
0.215
si:ch73-1a9.3
-0.031
stoml3b
0.215
h2afvb
-0.031
si:ch211-117n7.7
0.212
sumo3a
-0.030
zanl
0.207
hmgb1b
-0.030
eps8l3b
0.205
nucks1a
-0.030
rbp2a
0.202
cbx3a
-0.029
abcc2
0.202
setb
-0.029
wu:fb59d01
0.201
hmgb2b
-0.028
atp1a1a.4
0.201
si:ch211-137a8.4
-0.028
cyp3a65
0.200
ilf3b
-0.028
zgc:112146
0.200
hsp90ab1
-0.027
lgals2b
0.199
hdac1
-0.027
CU682777.2
0.199
hnrnpa1a
-0.027
fabp1b.1
0.199
tuba1a
-0.027
tmem176l.2
0.196
hnrnpa0a
-0.027
BX908782.3
0.189
top1l
-0.026
chia.2
0.189
hmgb3a
-0.026
si:ch211-137i24.10
0.187
ewsr1a
-0.026