
CDC42 effector protein (Rho GTPase binding) 2
ZFIN 
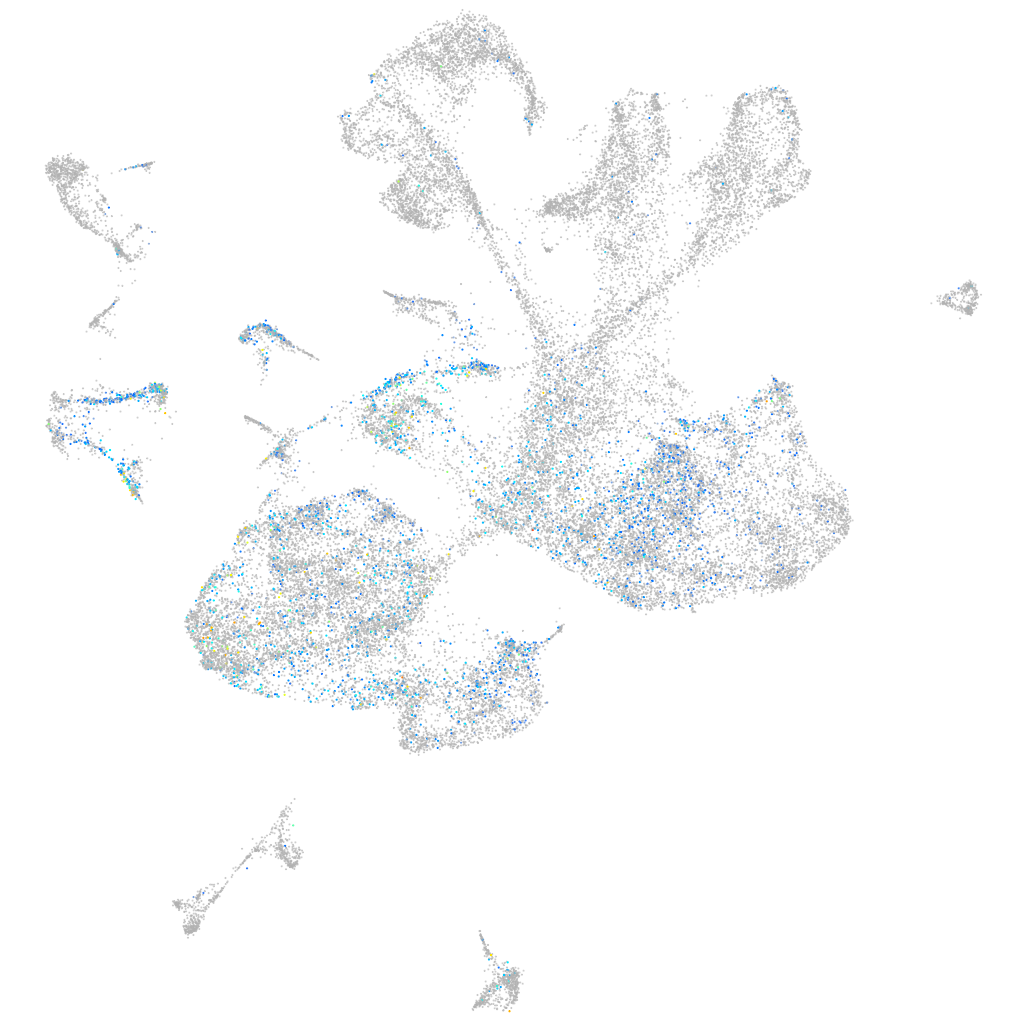
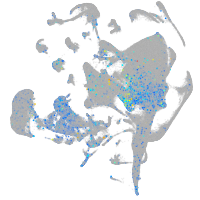
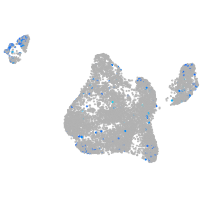
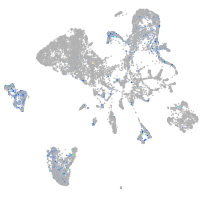
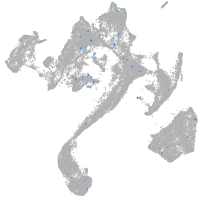
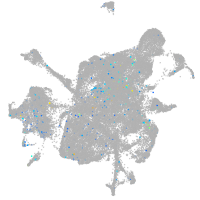
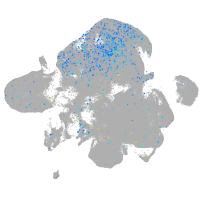
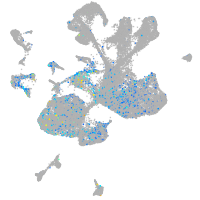
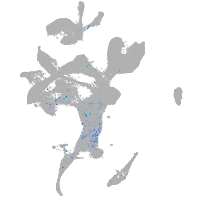
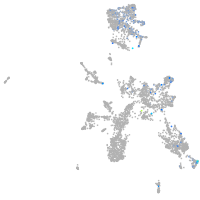
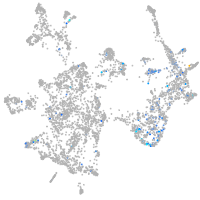
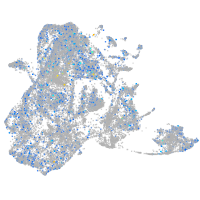
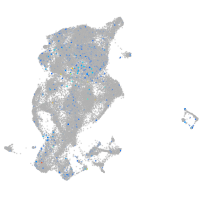
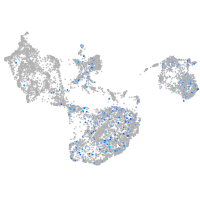
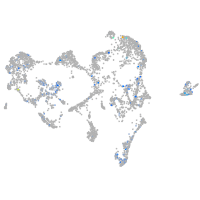
Gene expression UMAP


Expression by stage/cluster
Correlated gene expression
| Positive correlation | Negative correlation | ||
| Gene | r | Gene | r |
| ntn1b | 0.162 | elavl3 | -0.116 |
| metrnla | 0.162 | myt1b | -0.104 |
| spon1b | 0.154 | ptmaa | -0.102 |
| igfbp7 | 0.151 | stmn1b | -0.094 |
| wnt4b | 0.148 | gng3 | -0.090 |
| slit2 | 0.144 | ptmab | -0.090 |
| ptn | 0.143 | stxbp1a | -0.089 |
| col4a5 | 0.141 | vamp2 | -0.088 |
| sparc | 0.139 | stx1b | -0.088 |
| ptprfb | 0.138 | h3f3d | -0.087 |
| gpc5b | 0.137 | elavl4 | -0.087 |
| col4a6 | 0.133 | sncb | -0.086 |
| si:ch211-66e2.5 | 0.132 | gng2 | -0.084 |
| sparcl1 | 0.132 | jagn1a | -0.082 |
| rfx4 | 0.130 | si:dkey-276j7.1 | -0.081 |
| shha | 0.129 | rtn1a | -0.080 |
| slit1b | 0.129 | tubb5 | -0.080 |
| vwa7 | 0.126 | rtn1b | -0.080 |
| cd82a | 0.125 | zc4h2 | -0.080 |
| cav1 | 0.124 | tmem59l | -0.079 |
| atp1b4 | 0.123 | ywhah | -0.078 |
| cd81a | 0.123 | myt1a | -0.078 |
| hepacama | 0.123 | snap25a | -0.078 |
| atp1a1b | 0.122 | ywhag2 | -0.078 |
| si:ch73-265d7.2 | 0.122 | LOC100537384 | -0.078 |
| slc6a9 | 0.122 | onecut2 | -0.077 |
| notch3 | 0.121 | scrt2 | -0.075 |
| fabp7a | 0.121 | cplx2 | -0.075 |
| cavin1b | 0.121 | atp6v0cb | -0.075 |
| shhb | 0.121 | nsg2 | -0.075 |
| sulf1 | 0.120 | onecut1 | -0.074 |
| gpc1b | 0.119 | rbfox1 | -0.074 |
| slit1a | 0.119 | stmn2a | -0.074 |
| gpm6bb | 0.119 | syt2a | -0.074 |
| clu | 0.118 | atcaya | -0.073 |