
cyclin K
ZFIN 
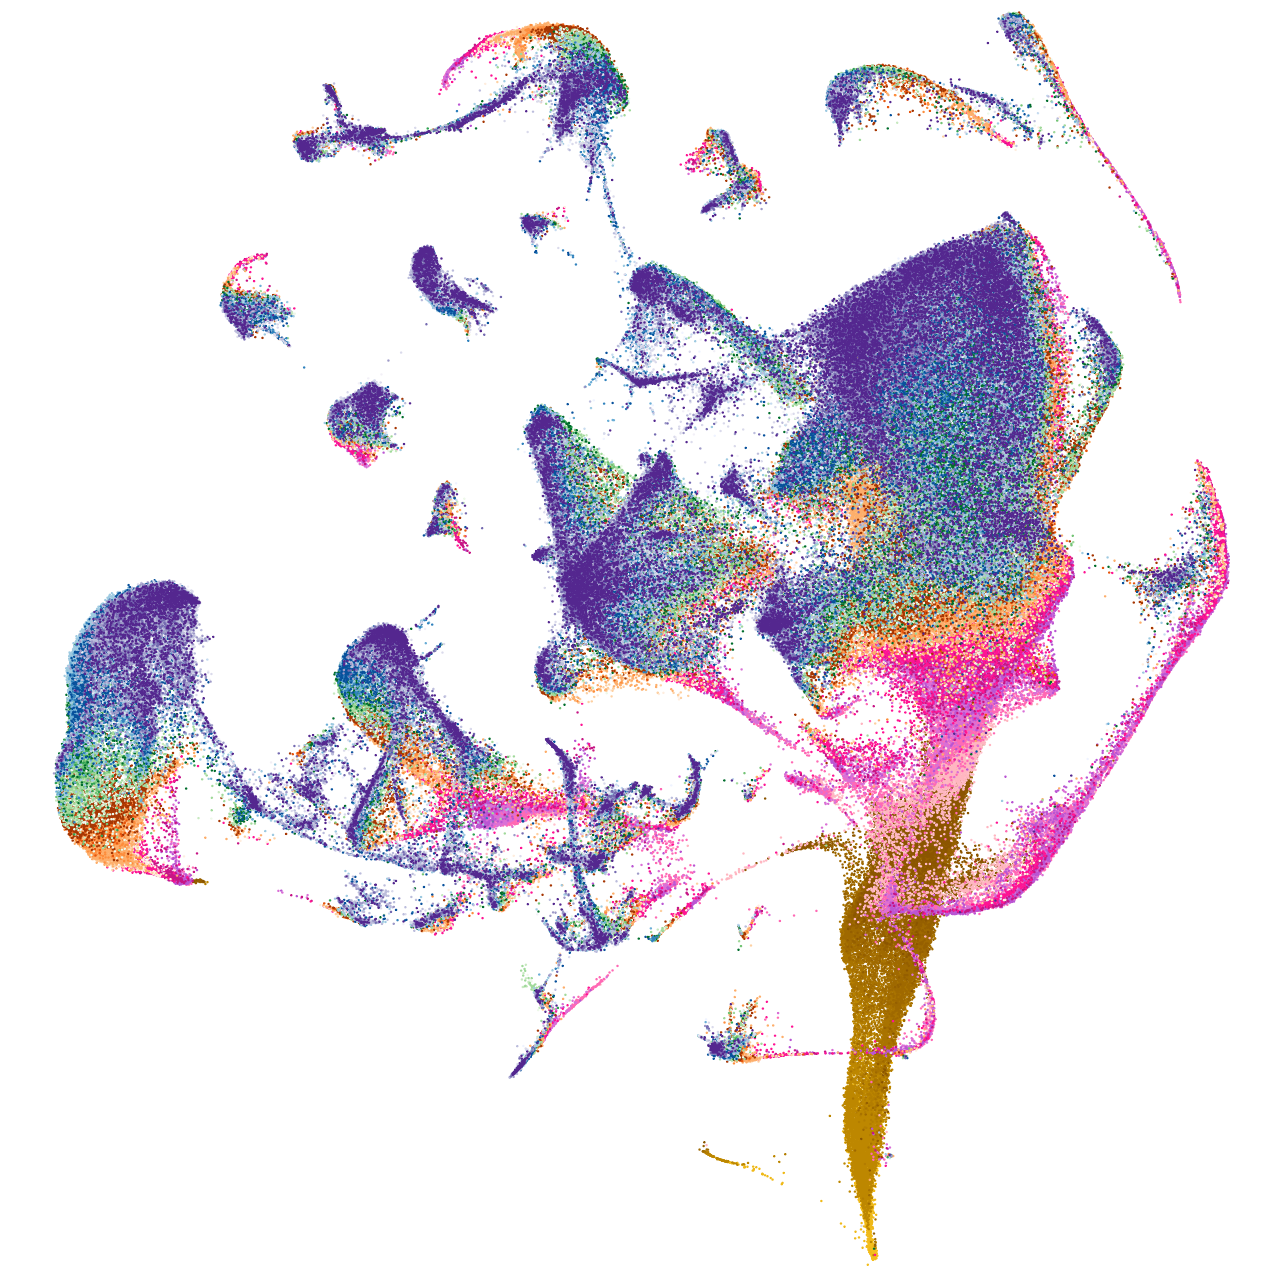
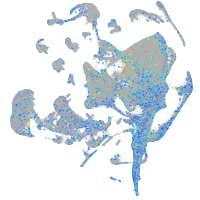
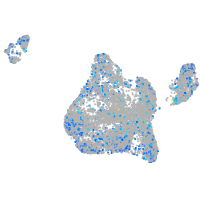
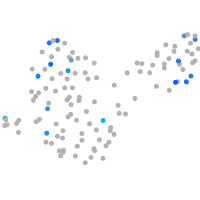
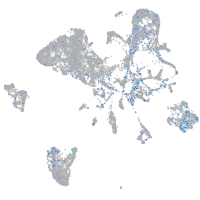
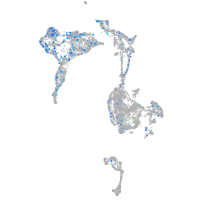
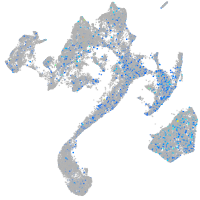
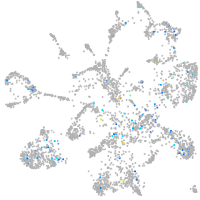
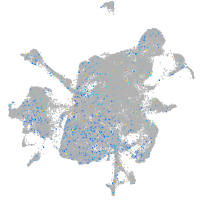
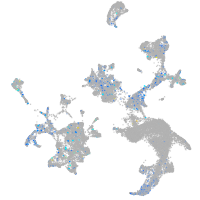
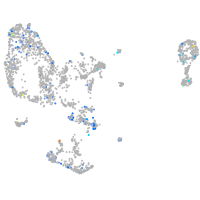
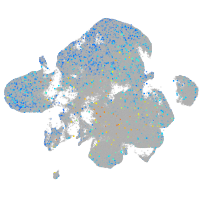
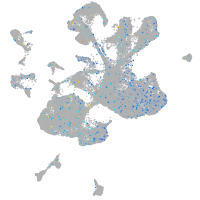
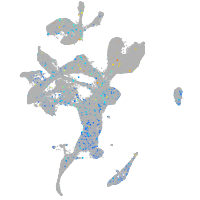
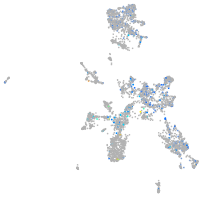
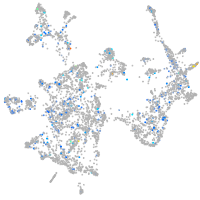
Gene expression UMAP


Expression by stage/cluster
Correlated gene expression
| Positive correlation | Negative correlation | ||
| Gene | r | Gene | r |
| ddx39ab | 0.090 | pvalb1 | -0.040 |
| snrpb | 0.090 | pvalb2 | -0.040 |
| nop58 | 0.087 | krt4 | -0.038 |
| seta | 0.085 | zgc:162730 | -0.038 |
| dkc1 | 0.084 | cyt1 | -0.037 |
| fbl | 0.084 | ier2b | -0.037 |
| ncl | 0.084 | anxa1a | -0.035 |
| cbx3a | 0.083 | cebpd | -0.035 |
| hnrnpa1b | 0.083 | krtt1c19e | -0.035 |
| snu13b | 0.083 | rbp4 | -0.035 |
| nop56 | 0.082 | krt5 | -0.034 |
| setb | 0.082 | actc1b | -0.033 |
| snrpd1 | 0.082 | cyt1l | -0.033 |
| npm1a | 0.081 | icn | -0.033 |
| mki67 | 0.080 | tob1b | -0.033 |
| snrpf | 0.080 | dap1b | -0.033 |
| srsf1a | 0.080 | hbbe1.3 | -0.032 |
| anp32b | 0.079 | s100a10b | -0.032 |
| ptges3b | 0.079 | s100v2 | -0.032 |
| rbm4.3 | 0.079 | hbae3 | -0.031 |
| snrpe | 0.079 | sparc | -0.031 |
| ilf2 | 0.077 | tmsb1 | -0.031 |
| ranbp1 | 0.077 | anxa2a | -0.030 |
| top1l | 0.077 | icn2 | -0.030 |
| hnrnpub | 0.076 | krt91 | -0.030 |
| ilf3b | 0.076 | lxn | -0.030 |
| nhp2 | 0.076 | tmem59 | -0.030 |
| ppig | 0.076 | col1a1b | -0.029 |
| srsf2a | 0.076 | fbp1a | -0.029 |
| cx43.4 | 0.075 | pycard | -0.029 |
| magoh | 0.075 | si:ch211-195b11.3 | -0.029 |
| ppm1g | 0.075 | apoa2 | -0.028 |
| taf15 | 0.075 | col1a1a | -0.028 |
| hdac1 | 0.074 | col1a2 | -0.028 |
| prmt1 | 0.074 | hbbe1.1 | -0.028 |