Daniocell
ccl19b (mesenchyme)
chemokine (C-C motif) ligand 19b
ZFIN
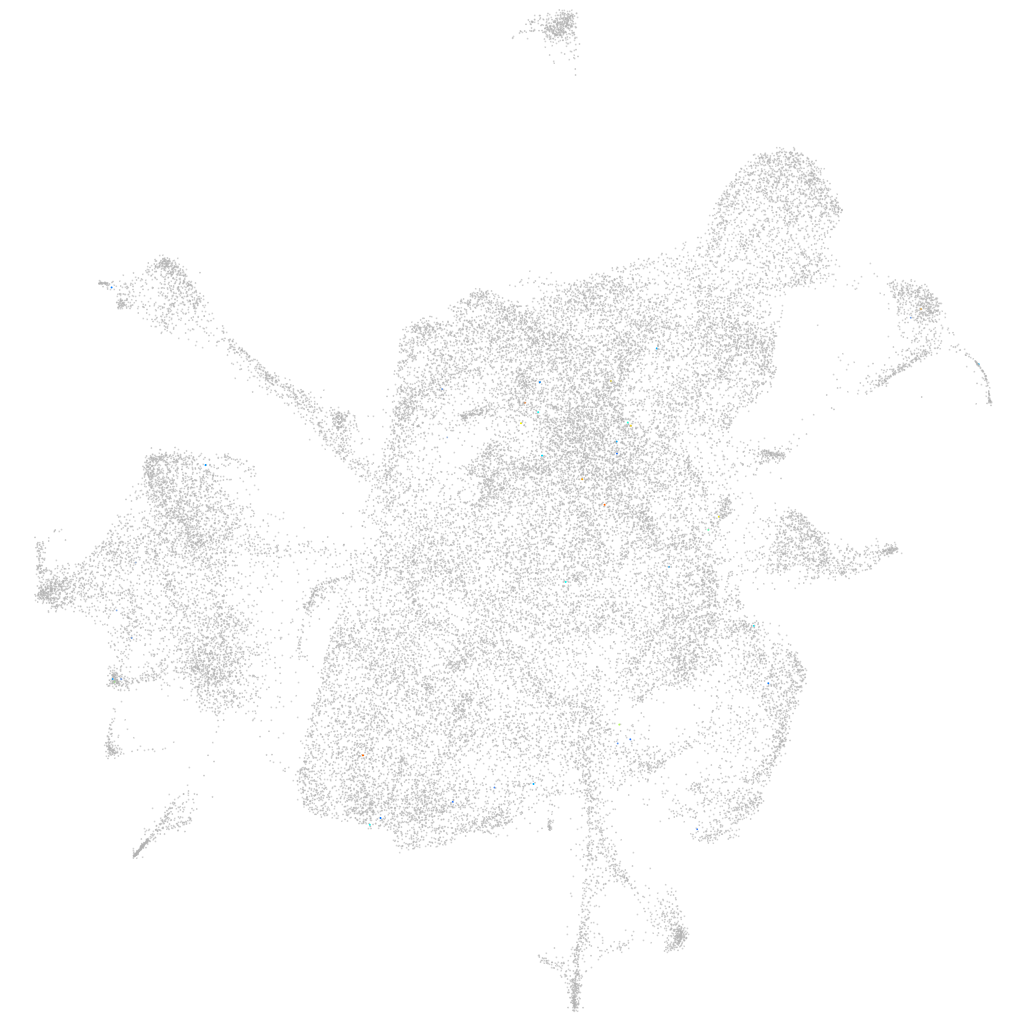
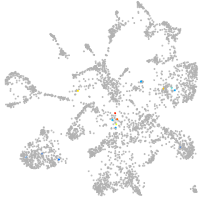
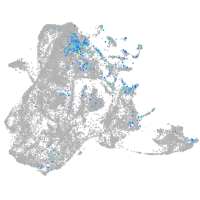
Gene expression UMAP
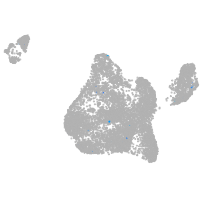
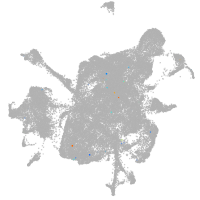
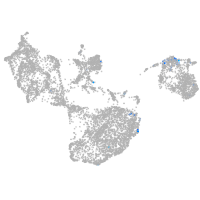
Display:
Expression
Stage
Other cell groups
all cells
blastomeres
PGCs
endoderm
axial mesoderm
muscle
mural cells /
non-skeletal muscle
mesenchyme
hematopoietic /
vasculature
pronephros
neural
spinal cord / glia
eye
taste / olfactory
otic / lateral line
epidermis
periderm
fin
ionocytes / mucous
pigment cells
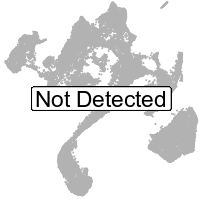
Expression by stage/cluster
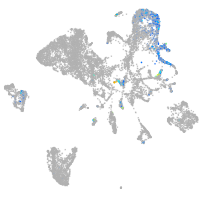
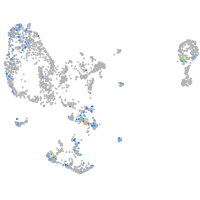
Correlated gene expression
Positive correlation
Negative correlation
Gene
r
Gene
r
si:ch73-256j6.6
0.266
zgc:193541
-0.019
XLOC-031233
0.195
mt-cyb
-0.015
mfsd6l
0.164
rpl24
-0.015
LO018680.1
0.150
chd4a
-0.015
lrrc53
0.113
cmpk
-0.014
trim54
0.100
capza1b
-0.013
XLOC-030409
0.093
hmgn6
-0.013
LOC100535838
0.086
cd248b
-0.013
XLOC-028466
0.081
erh
-0.013
CR848759.1
0.079
ybx1
-0.013
si:ch211-262i1.4
0.079
krtcap2
-0.013
urp2
0.077
ptges3b
-0.013
chrnd
0.075
pdia6
-0.012
XLOC-026715
0.072
ndufb8
-0.012
XLOC-025051
0.070
rab6a
-0.012
LOC103911920
0.070
tcf12
-0.012
RF00430
0.065
snrpd2
-0.012
tlx2
0.064
ddost
-0.012
msc
0.063
rps19
-0.012
LOC110438155
0.063
hmga1a
-0.012
si:dkey-33c3.1
0.060
atp5f1c
-0.012
CR631122.1
0.059
rbm25b
-0.012
tapbpl
0.059
sem1
-0.012
CABZ01026153.1
0.059
ebf1a
-0.012
LOC110437755
0.058
eny2
-0.012
LOC103910948
0.055
mcm7
-0.012
cftr
0.055
oaz1b
-0.011
tlx1
0.054
tubb2b
-0.011
LOC101882460
0.053
golgb1
-0.011
ubap1la
0.053
clic4
-0.011
CT573337.1
0.051
atf4b
-0.011
AL732567.1
0.050
eif5
-0.011
si:ch73-256j6.2
0.048
zfyve21
-0.011
LOC110439360
0.048
sox11a
-0.011
si:dkey-125i10.3
0.046
tuba8l3
-0.011