Daniocell
cars2 (taste / olfactory)
"cysteinyl-tRNA synthetase 2, mitochondrial"
ZFIN
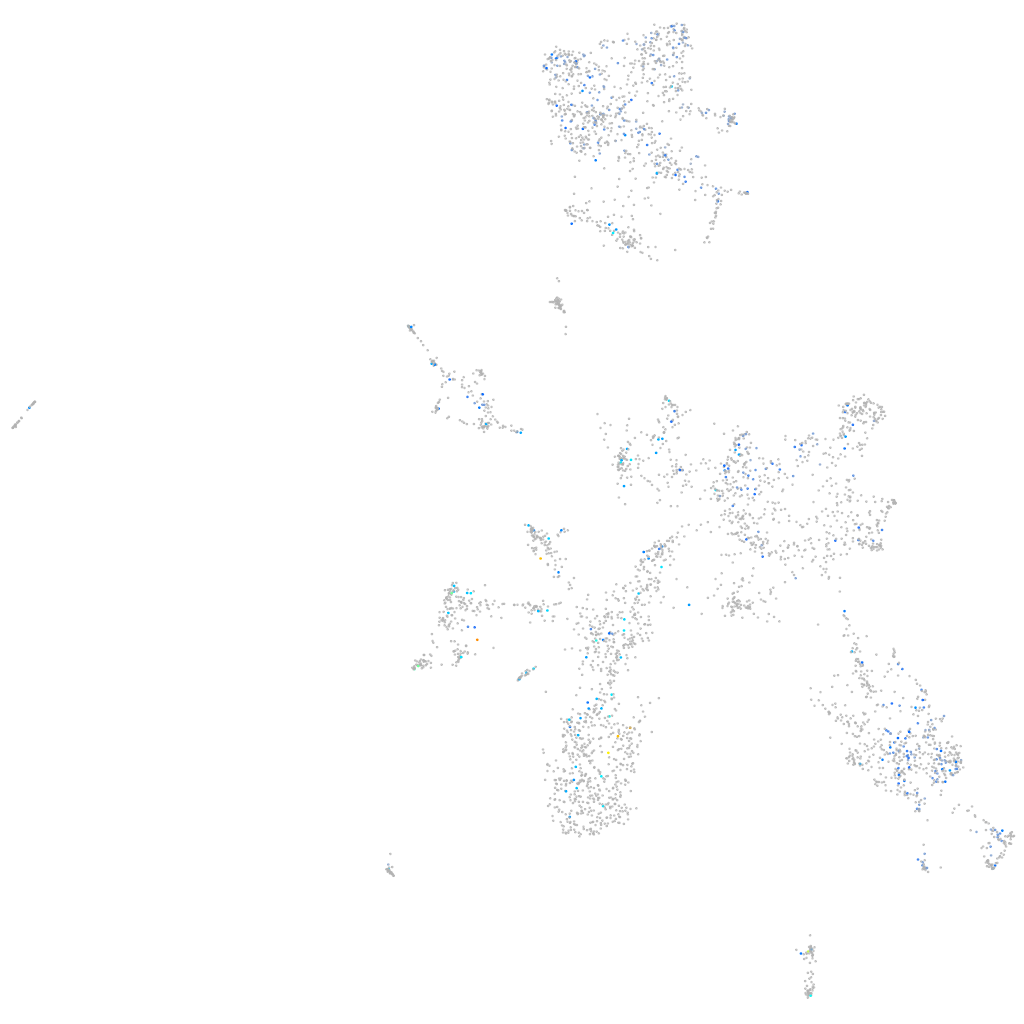
Gene expression UMAP
Display:
Expression
Stage
Other cell groups
all cells
blastomeres
PGCs
endoderm
axial mesoderm
muscle
mural cells /
non-skeletal muscle
mesenchyme
hematopoietic /
vasculature
pronephros
neural
spinal cord / glia
eye
taste / olfactory
otic / lateral line
epidermis
periderm
fin
ionocytes / mucous
pigment cells
Expression by stage/cluster
Correlated gene expression
Positive correlation
Negative correlation
Gene
r
Gene
r
LOC101883107
0.160
pabpc1a
-0.067
LOC103910731
0.155
etf1b
-0.046
XLOC-034235
0.154
XLOC-035413
-0.043
tmem82
0.138
rpl10
-0.042
LOC110440093
0.138
rps15
-0.040
si:dkey-27d5.3
0.138
gpx8
-0.038
si:dkeyp-4f2.6
0.135
rpl29
-0.038
CR383668.2
0.131
ccne2
-0.038
si:ch211-196f19.1
0.130
fen1
-0.037
LOC103911803
0.130
tnnc2
-0.037
si:ch73-361p23.3
0.129
tpm4a
-0.037
slc22a7a
0.127
hp1bp3
-0.037
zgc:136605
0.126
ddx21
-0.037
AL954861.1
0.125
apoa1b
-0.036
XLOC-028466
0.125
rps23
-0.035
cbln11
0.120
mir205
-0.035
prkcg
0.120
si:dkey-151g10.6
-0.035
XLOC-023755
0.119
rplp1
-0.035
XLOC-043782
0.118
fblim1
-0.035
LOC561873
0.116
orc6
-0.035
LOC110440075
0.116
ndfip2
-0.034
inpp5kb
0.114
XLOC-042222
-0.034
CNNM1
0.114
si:dkey-234h16.7
-0.034
CU633999.1
0.112
slc12a7a
-0.034
LOC110440174
0.109
p3h1
-0.033
LOC108179656
0.108
tp53
-0.033
vav3a
0.107
mir181b-3
-0.033
rtn2b
0.107
npm2a
-0.033
pomgnt2
0.106
ccnd1
-0.033
fli1a
0.106
rpl32
-0.033
LOC110439590
0.105
bhmt
-0.033
or118-3
0.105
tle3a
-0.033
BX005085.1
0.103
eif2a
-0.033
LOC103908953
0.103
ccdc18
-0.033
BX323559.2
0.102
mcm5
-0.032