Daniocell
cars2 (epidermis)
"cysteinyl-tRNA synthetase 2, mitochondrial"
ZFIN
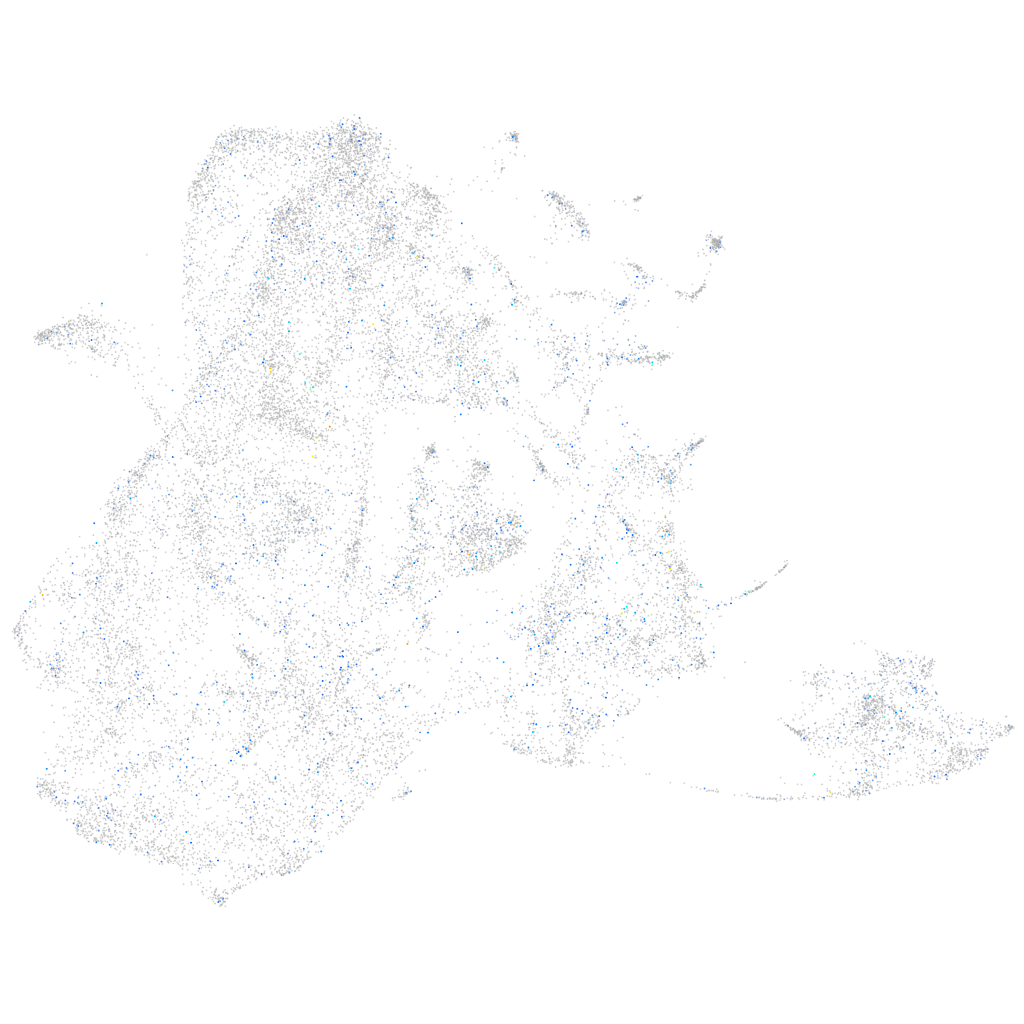
Gene expression UMAP
Display:
Expression
Stage
Other cell groups
all cells
blastomeres
PGCs
endoderm
axial mesoderm
muscle
mural cells /
non-skeletal muscle
mesenchyme
hematopoietic /
vasculature
pronephros
neural
spinal cord / glia
eye
taste / olfactory
otic / lateral line
epidermis
periderm
fin
ionocytes / mucous
pigment cells
Expression by stage/cluster
Correlated gene expression
Positive correlation
Negative correlation
Gene
r
Gene
r
igfals
0.100
cyt1
-0.052
cnn1a
0.096
cyt1l
-0.047
LOC101886033
0.092
actb2
-0.046
gata4
0.091
krt4
-0.044
XLOC-011609
0.091
pfn1
-0.043
LOC796088
0.083
krtt1c19e
-0.041
si:ch73-359m17.6
0.083
zgc:175088
-0.041
XLOC-043742
0.076
krt5
-0.039
si:dkey-246j6.3
0.074
zgc:101810
-0.038
si:ch211-132g1.6
0.072
rbp4
-0.038
ighv5-2
0.072
aep1
-0.036
LOC101886731
0.072
ptgdsb.1
-0.035
CU019662.1
0.072
wu:fa03e10
-0.034
XLOC-039672
0.070
si:dkey-33c14.3
-0.034
CR933528.1
0.070
si:dkey-16p21.8
-0.033
CU571091.1
0.067
ecrg4b
-0.033
BX957333.1
0.065
CU693494.2
-0.033
LOC103908743
0.065
s100a10b
-0.032
thsd7ab
0.064
col2a1b
-0.032
CABZ01085140.1
0.064
cfl1l
-0.032
ttc34
0.063
lgals1l1
-0.031
chata
0.062
spaca4l
-0.031
si:ch73-379j16.2
0.062
zgc:136930
-0.031
BX511021.1
0.061
gamt
-0.031
LOC110439514
0.061
tmsb4x
-0.030
FP015866.1
0.061
ppt1
-0.030
celsr3
0.061
pabpc1b
-0.029
XLOC-041558
0.061
thy1
-0.028
LOC103910253
0.060
col11a1a
-0.028
mt-co2
0.059
col1a2
-0.028
si:dkey-85k7.11
0.059
sparc
-0.027
si:dkey-150i13.2
0.058
krt91
-0.027
XLOC-029654
0.058
itgb3a
-0.026
mt-atp6
0.057
csrp1a
-0.026
si:dkey-146c18.5
0.056
col1a1b
-0.026