Daniocell
cacna2d1a (fin)
"calcium channel, voltage-dependent, alpha 2/delta subunit 1a"
ZFIN
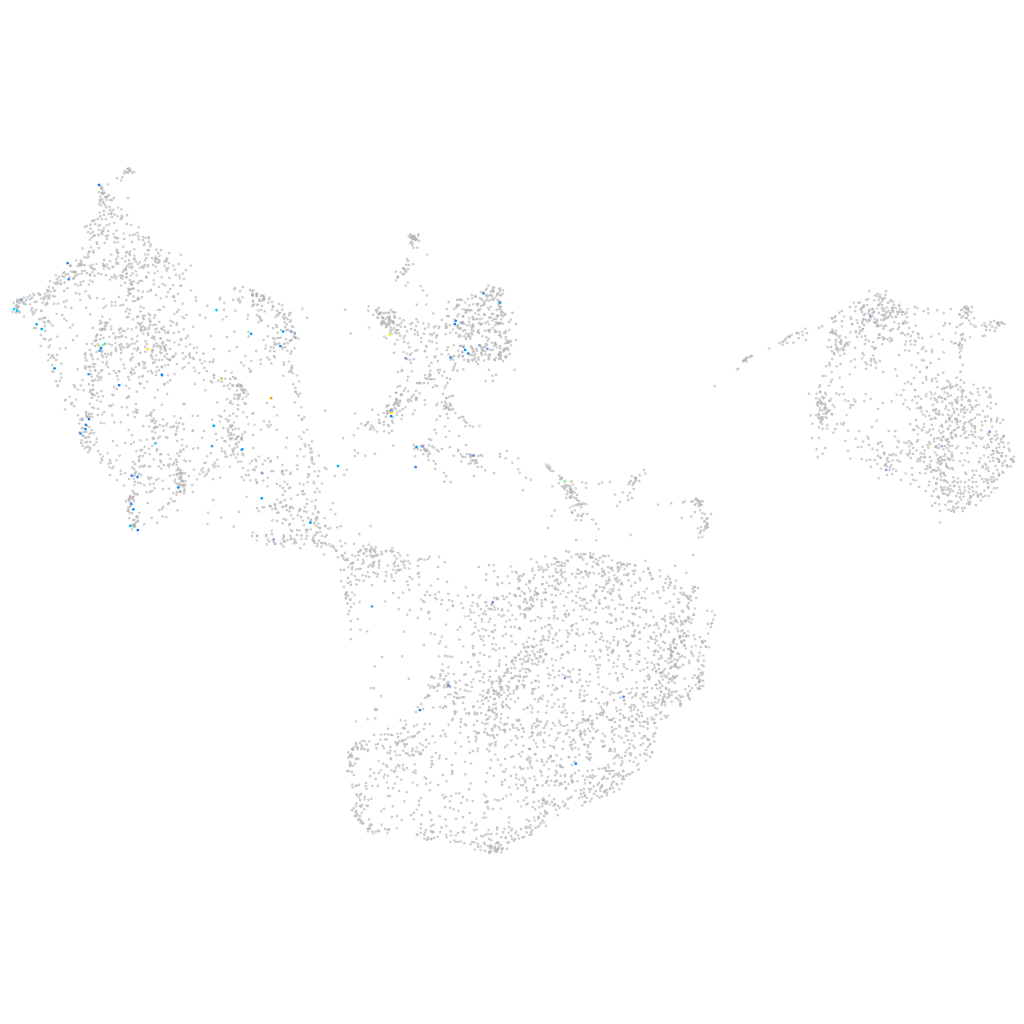
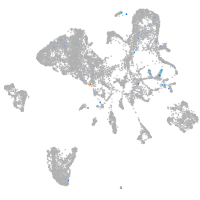
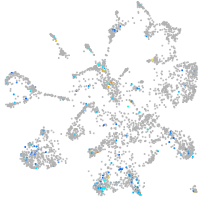
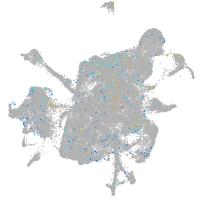
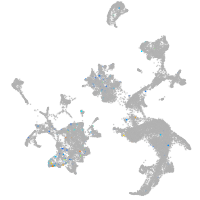
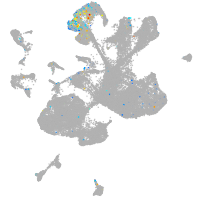
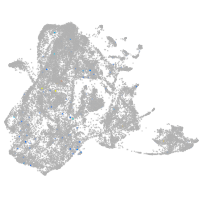
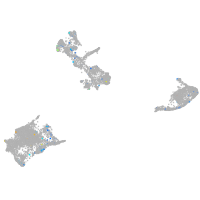
Gene expression UMAP
Display:
Expression
Stage
Other cell groups
all cells
blastomeres
PGCs
endoderm
axial mesoderm
muscle
mural cells /
non-skeletal muscle
mesenchyme
hematopoietic /
vasculature
pronephros
neural
spinal cord / glia
eye
taste / olfactory
otic / lateral line
epidermis
periderm
fin
ionocytes / mucous
pigment cells
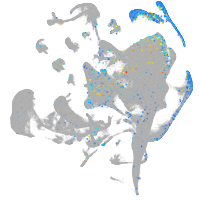
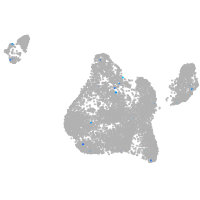
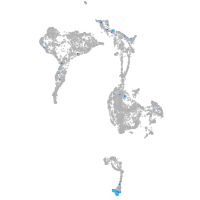
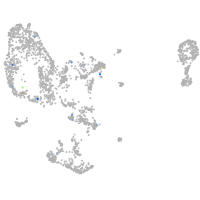
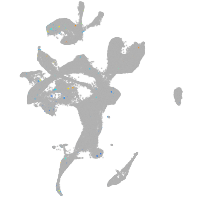
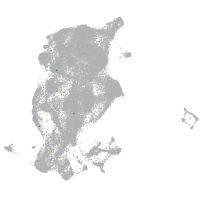
Expression by stage/cluster
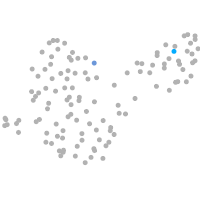
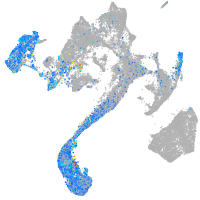
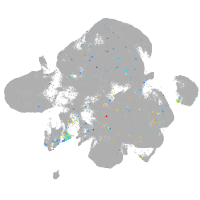
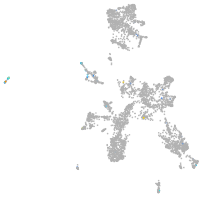
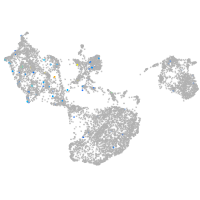
Correlated gene expression
Positive correlation
Negative correlation
Gene
r
Gene
r
BX649423.2
0.211
tmsb1
-0.102
ifit9
0.207
cfl1l
-0.101
si:ch211-202m22.1
0.200
pfn1
-0.099
XLOC-033953
0.183
tmsb4x
-0.097
pimr65
0.181
epcam
-0.095
LOC570405.1
0.164
cldni
-0.095
lhpp
0.156
cyt1
-0.093
CR936977.2
0.153
s100a10b
-0.093
LOC103910031
0.152
krt4
-0.090
si:dkey-225k4.1
0.148
cotl1
-0.090
LOC110438288
0.140
cldn1
-0.088
BX649434.1
0.136
icn
-0.086
CT009487.2
0.133
anxa1a
-0.083
BX936386.1
0.132
spaca4l
-0.082
si:ch211-22d5.2
0.132
bcam
-0.082
gas2a
0.128
tagln2
-0.081
XLOC-007245
0.127
wu:fb18f06
-0.080
si:ch73-93k15.5
0.126
myh9a
-0.080
SLC35G1
0.125
cap1
-0.079
ctss2.1
0.122
col18a1a
-0.079
LOC101885924
0.121
si:dkey-248g15.3
-0.077
LOC110438172
0.119
ecrg4b
-0.077
KLHL28
0.119
apoeb
-0.077
XLOC-003375
0.118
actb1
-0.076
thbd
0.118
rac2
-0.076
CR407561.1
0.117
thy1
-0.076
lrtm2b
0.116
arhgdig
-0.076
FO704741.1
0.116
abracl
-0.075
chrm1b
0.115
arhgef5
-0.075
LOC101884613
0.115
egfl6
-0.075
XLOC-019823
0.114
zgc:92380
-0.074
trpc2b
0.114
myl12.1
-0.074
rhol
0.114
si:dkey-102c8.3
-0.074
rabl6a
0.112
pycard
-0.073
slc9a3.2
0.111
krt5
-0.073