Daniocell
c1qtnf6a (pronephros)
C1q and TNF related 6a
ZFIN
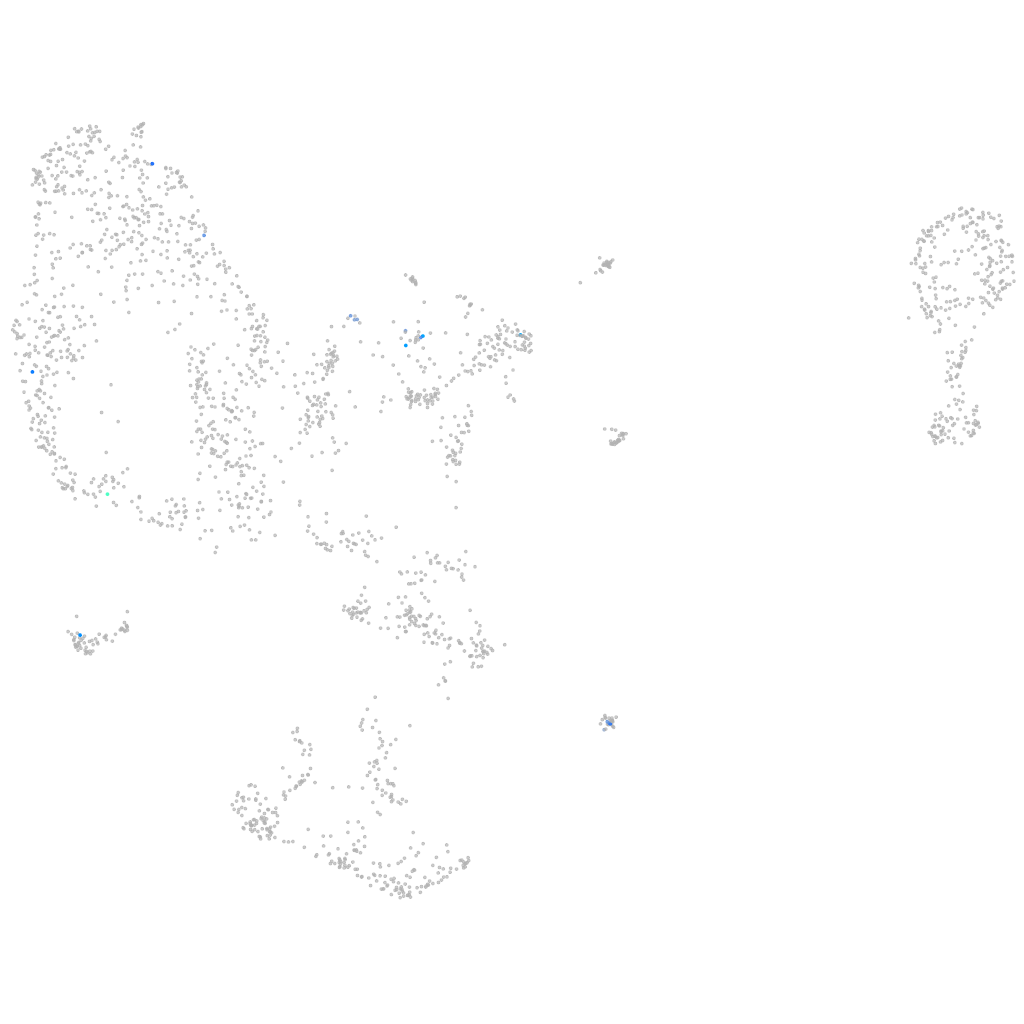
Gene expression UMAP
Display:
Expression
Stage
Other cell groups
all cells
blastomeres
PGCs
endoderm
axial mesoderm
muscle
mural cells /
non-skeletal muscle
mesenchyme
hematopoietic /
vasculature
pronephros
neural
spinal cord / glia
eye
taste / olfactory
otic / lateral line
epidermis
periderm
fin
ionocytes / mucous
pigment cells
Expression by stage/cluster
Correlated gene expression
Positive correlation
Negative correlation
Gene
r
Gene
r
LOC108181656
0.555
fth1a
-0.058
LOC101885553
0.513
tuba8l2
-0.054
LOC101883622
0.507
cox7b
-0.052
c1qtnf6b
0.501
lyrm7
-0.052
pappab
0.497
etnk1
-0.051
XLOC-018221
0.466
fam133b
-0.051
chrnb1
0.456
cdh17
-0.051
col27a1b
0.428
mrps24
-0.050
LOC101884473
0.424
mrpl33
-0.050
pcolcea
0.400
osbpl9
-0.047
nhsl1a
0.392
NC-002333.4
-0.047
cthrc1a
0.383
si:dkey-44g23.5
-0.046
MMP23B
0.375
ccdc47
-0.046
XLOC-041467
0.368
cldnh
-0.046
LOC101882521
0.368
phb
-0.045
b3gnt9
0.366
nedd8
-0.045
capn5b
0.356
uqcrh
-0.045
LOC108180743
0.356
dusp4
-0.043
RYR2
0.356
zgc:112255
-0.042
scrt1b
0.349
si:dkeyp-27c8.2
-0.042
LOC100535838
0.348
tspan11
-0.042
fgfr1bl
0.344
auh
-0.041
ngfa
0.344
prpf40a
-0.041
pmch
0.344
hnf1ba
-0.041
XLOC-023752
0.344
ap1s1
-0.041
LO018104.1
0.344
slc43a2b
-0.041
LOC101883142
0.344
srsf3b
-0.040
LOC110438555
0.344
hnrnpl
-0.040
XLOC-044325
0.344
hmgn6
-0.040
htr2b
0.344
si:dkey-39a18.1
-0.040
thsd7ab
0.342
mmaa
-0.040
XLOC-015429
0.339
chchd2
-0.040
si:ch211-250n8.1
0.336
slc4a2a
-0.040
BX248238.1
0.329
gpx4b
-0.039
CR847970.1
0.329
eno3
-0.039