Daniocell
c1qtnf6a (fin)
C1q and TNF related 6a
ZFIN
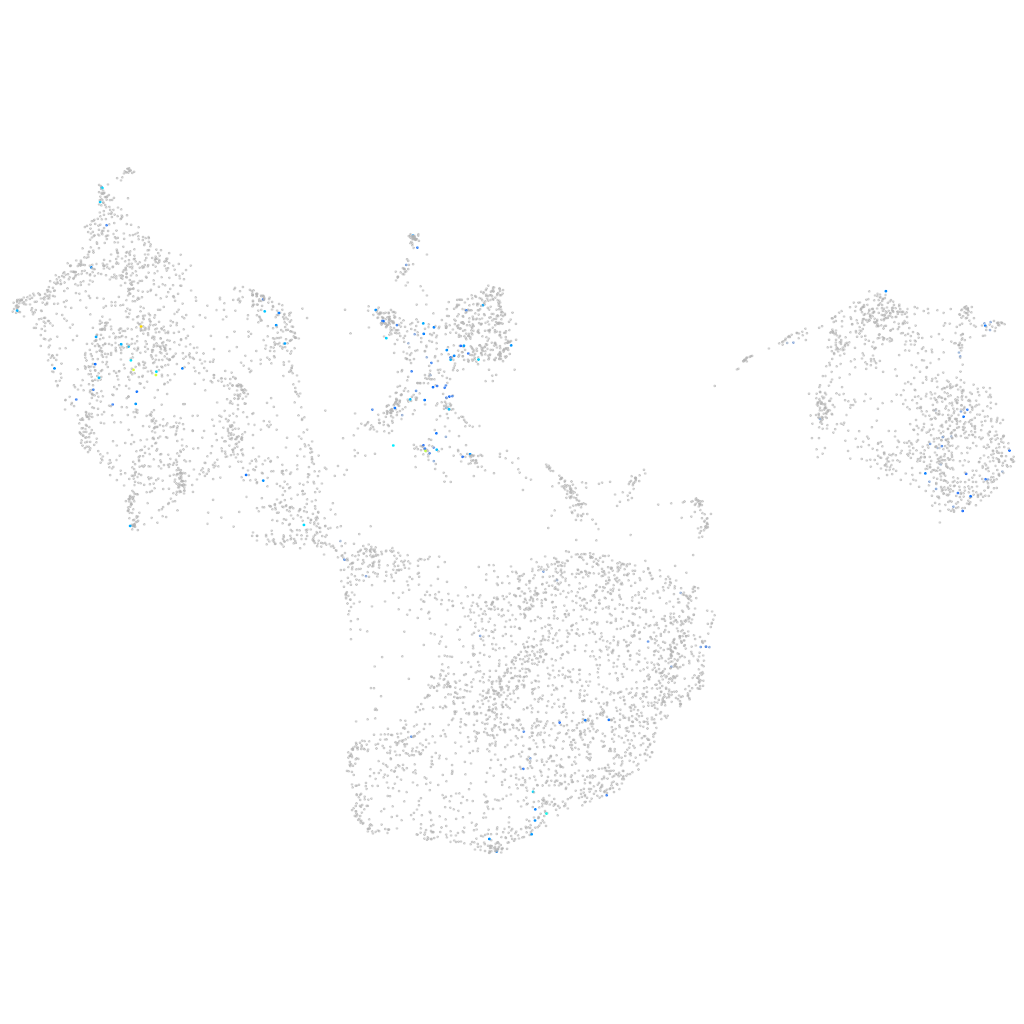
Gene expression UMAP
Display:
Expression
Stage
Other cell groups
all cells
blastomeres
PGCs
endoderm
axial mesoderm
muscle
mural cells /
non-skeletal muscle
mesenchyme
hematopoietic /
vasculature
pronephros
neural
spinal cord / glia
eye
taste / olfactory
otic / lateral line
epidermis
periderm
fin
ionocytes / mucous
pigment cells
Expression by stage/cluster
Correlated gene expression
Positive correlation
Negative correlation
Gene
r
Gene
r
LOC110438323
0.195
cyt1l
-0.060
XLOC-026578
0.187
pfn1
-0.060
tmem170b
0.164
krt5
-0.058
LOC110438087
0.161
krt4
-0.058
CR925728.1
0.155
tmsb4x
-0.057
XLOC-043310
0.151
cyt1
-0.057
si:ch73-18b11.2
0.144
cfl1l
-0.057
hjv
0.141
col28a2a
-0.057
CU914487.1
0.140
zgc:92380
-0.056
LOC108182776
0.137
myh9a
-0.055
si:dkeyp-82a1.4
0.131
zgc:175088
-0.053
BX510934.2
0.128
s100a10b
-0.053
LOC101884238
0.128
itgb4
-0.052
LOC110438150
0.128
scinla
-0.051
RIMS2
0.128
tmsb1
-0.051
fstl3
0.127
wu:fb18f06
-0.050
rsph14
0.125
actb1
-0.050
alkal1
0.123
DSG2
-0.050
LOC557811
0.121
col18a1a
-0.048
cox4i2
0.121
icn
-0.048
pdgfrl
0.119
col14a1b
-0.047
si:dkey-40j3.3
0.117
rac2
-0.047
CU929150.1
0.117
cap1
-0.047
CR394546.3
0.117
abracl
-0.046
ifitm1
0.117
arhgef5
-0.046
osr1
0.116
ptgdsb.1
-0.046
LOC110438288
0.116
krtt1c19e
-0.046
si:dkey-57k2.6
0.116
cotl1
-0.045
fgf18b
0.116
cldn1
-0.045
adamts15a
0.115
efhd2
-0.045
slc47a3
0.114
itgb1b.1
-0.045
LOC100536144
0.114
pak2a
-0.044
cfap157
0.114
itgb3a
-0.044
fam167ab
0.113
myl12.1
-0.044
CR559945.1
0.113
col17a1a
-0.044