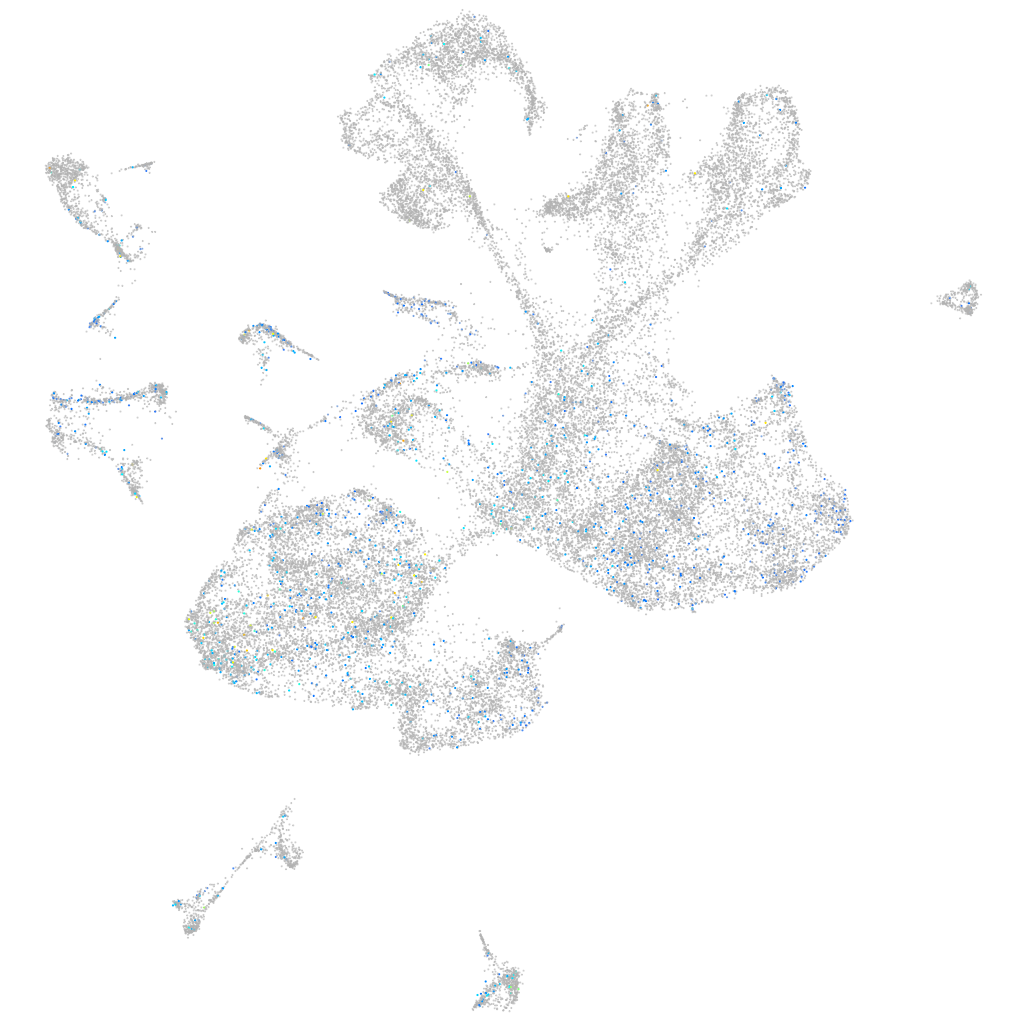
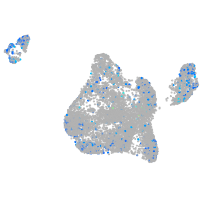
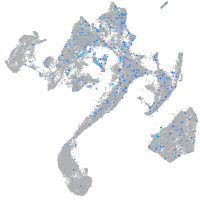
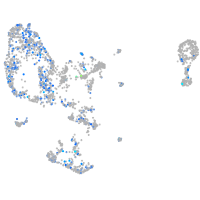
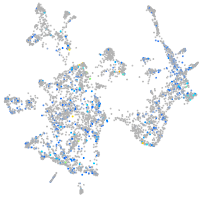
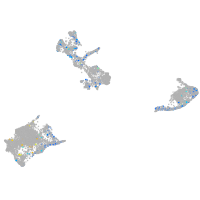
"core 1 synthase, glycoprotein-N-acetylgalactosamine 3-beta-galactosyltransferase, 1b"
ZFIN 
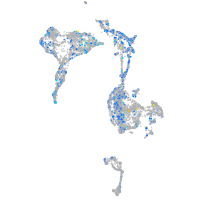
Expression by stage/cluster


Correlated gene expression


| Positive correlation | Negative correlation | ||
| Gene | r | Gene | r |
| hspb12 | 0.077 | elavl3 | -0.078 |
| si:ch1073-303k11.2 | 0.073 | myt1b | -0.065 |
| hepacama | 0.070 | ptmaa | -0.065 |
| si:ch211-66e2.5 | 0.068 | stmn1b | -0.057 |
| fabp7a | 0.068 | ptmab | -0.056 |
| gpr37l1b | 0.067 | h3f3d | -0.055 |
| gpm6bb | 0.067 | stx1b | -0.055 |
| id1 | 0.065 | sncb | -0.054 |
| ptprfb | 0.065 | elavl4 | -0.053 |
| sparc | 0.064 | myt1a | -0.053 |
| fkbp14 | 0.064 | stxbp1a | -0.053 |
| atp1b4 | 0.064 | rtn1a | -0.052 |
| ppap2d | 0.063 | si:ch211-222l21.1 | -0.052 |
| asph | 0.063 | gng3 | -0.051 |
| cx43 | 0.063 | nsg2 | -0.051 |
| atp1b1a | 0.062 | snap25a | -0.050 |
| qki2 | 0.062 | tmsb | -0.050 |
| FP102888.1 | 0.062 | gng2 | -0.050 |
| ptn | 0.062 | hmgb3a | -0.049 |
| atp1a1b | 0.062 | LOC100537384 | -0.048 |
| cd82a | 0.061 | syt2a | -0.048 |
| ptprz1b | 0.061 | onecut1 | -0.048 |
| igfbp7 | 0.061 | zc4h2 | -0.047 |
| sox2 | 0.061 | tmeff1b | -0.047 |
| ssuh2rs1 | 0.059 | si:ch73-386h18.1 | -0.047 |
| fgfr2 | 0.059 | onecut2 | -0.047 |
| spry2 | 0.058 | epb41a | -0.047 |
| sypl2a | 0.058 | cplx2 | -0.047 |
| anxa13 | 0.058 | tmem59l | -0.047 |
| pgrmc1 | 0.058 | rbfox1 | -0.046 |
| metrnla | 0.058 | thsd7aa | -0.046 |
| msi1 | 0.058 | jagn1a | -0.046 |
| anxa4 | 0.058 | vamp2 | -0.046 |
| slc1a2b | 0.057 | cplx2l | -0.046 |
| krt8 | 0.057 | ywhah | -0.045 |


