Daniocell
bzw2 (mural cells / non-skeletal muscle)
basic leucine zipper and W2 domains 2
ZFIN
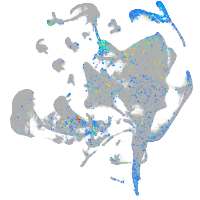
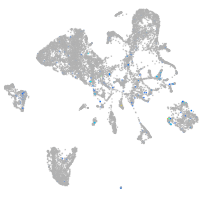
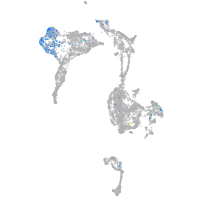
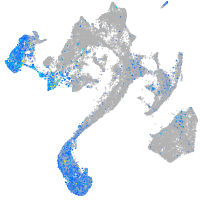
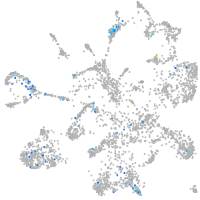
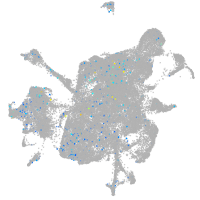
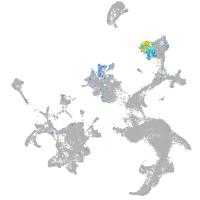
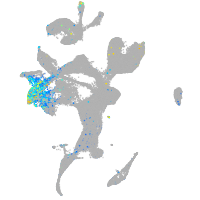
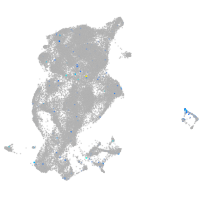
Gene expression UMAP
Display:
Expression
Stage
Other cell groups
all cells
blastomeres
PGCs
endoderm
axial mesoderm
muscle
mural cells /
non-skeletal muscle
mesenchyme
hematopoietic /
vasculature
pronephros
neural
spinal cord / glia
eye
taste / olfactory
otic / lateral line
epidermis
periderm
fin
ionocytes / mucous
pigment cells
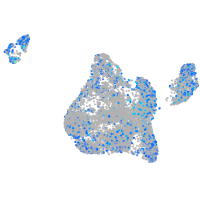
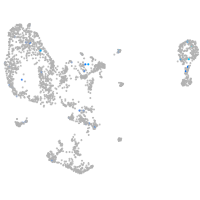
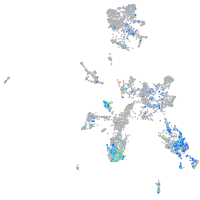
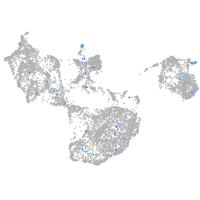
Expression by stage/cluster
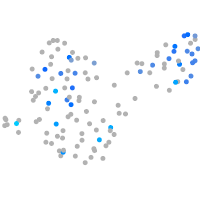
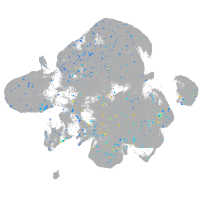
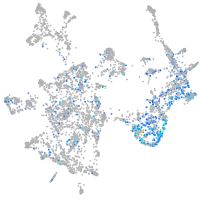
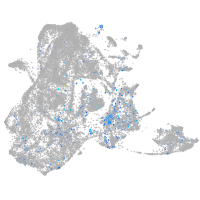
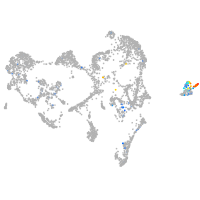
Correlated gene expression
Positive correlation
Negative correlation
Gene
r
Gene
r
LOC108184024
0.212
marcksl1a
-0.116
LOC108184071
0.200
mdka
-0.083
LOC101882303
0.190
si:ch1073-291c23.2
-0.075
si:dkey-164f24.2
0.177
mmp16a
-0.068
crygm2d5
0.176
marcksl1b
-0.068
loxa
0.173
si:ch211-286o17.1
-0.063
htra1a
0.168
hmga2
-0.063
soat2
0.165
cpn1
-0.060
fgf11a
0.156
pmp22a
-0.059
si:ch211-1a19.3
0.153
NC-002333.4
-0.059
tlx1
0.152
jam2b
-0.059
kctd16b
0.152
pdgfra
-0.057
XLOC-020556
0.149
hic1
-0.054
zgc:174938
0.148
hbae3
-0.054
BX663503.3
0.146
NC-002333.17
-0.053
si:dkey-66a8.7
0.145
XLOC-041870
-0.052
FO704758.1
0.142
podxl
-0.051
mamdc2a
0.140
lamb1b
-0.050
si:dkeyp-72e1.9
0.140
nkd1
-0.049
fbln5
0.140
fstl1a
-0.049
pgk1
0.133
CR383676.1
-0.049
trim55a
0.133
hmgb2b
-0.048
filip1b
0.130
si:ch73-281n10.2
-0.048
slmapa
0.130
hmgb2a
-0.047
BX936456.1
0.130
cebpa
-0.047
tekt2
0.128
si:dkey-195m11.8
-0.047
aldocb
0.128
tbx2b
-0.047
si:ch73-236c18.7
0.128
krt4
-0.046
mybpc1
0.127
sept15
-0.045
fbp2
0.125
zmiz1a
-0.045
CSDC2 (1 of many)
0.125
mt-co2
-0.045
pfkpa
0.123
fabp11a
-0.045
pkma
0.123
si:ch211-39i22.1
-0.044
hpgd
0.121
tmsb1
-0.044
gapdhs
0.120
pdgfrb
-0.044