Daniocell
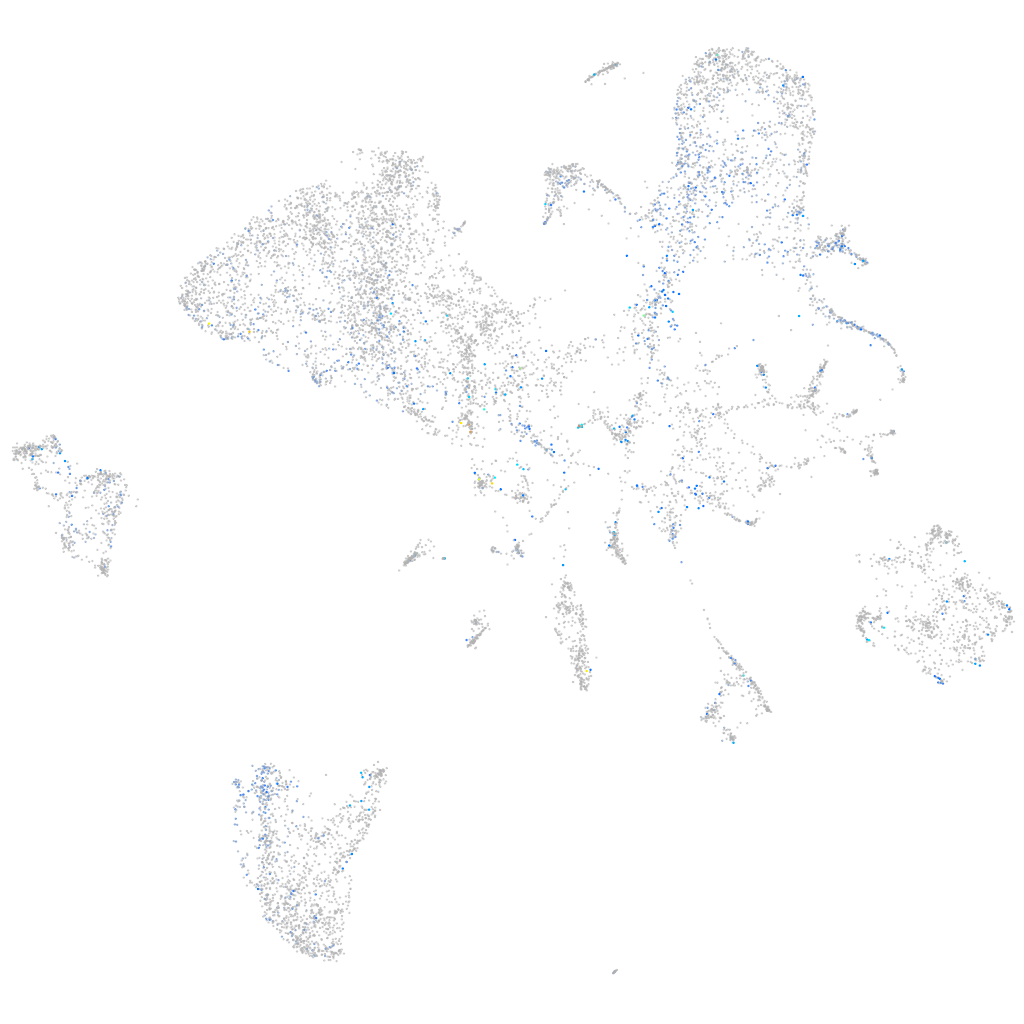
bcl2l13 (endoderm)
BCL2 like 13
ZFIN
Gene expression UMAP
Display:
Expression
Stage
Other cell groups
all cells
blastomeres
PGCs
endoderm
axial mesoderm
muscle
mural cells /
non-skeletal muscle
mesenchyme
hematopoietic /
vasculature
pronephros
neural
spinal cord / glia
eye
taste / olfactory
otic / lateral line
epidermis
periderm
fin
ionocytes / mucous
pigment cells
Expression by stage/cluster
Correlated gene expression
Positive correlation
Negative correlation
Gene
r
Gene
r
si:ch73-379f5.5
0.256
apoc1
-0.102
LOC103910192
0.254
pnp4b
-0.089
grna
0.243
fetub
-0.084
si:dkeyp-93a5.3
0.240
comtd1
-0.079
LOC110438226
0.239
ttr
-0.078
si:ch73-106l15.4
0.237
rbp4
-0.077
myh11b
0.235
cyp2ad2
-0.076
si:ch73-182e20.4
0.218
ces2
-0.075
LOC100538255
0.209
gc
-0.074
BX571884.1
0.184
fabp10a
-0.071
LOC103909050
0.184
zgc:123103
-0.070
LO018107.1
0.183
ces3
-0.070
zgc:172339
0.182
crp2
-0.070
jac7
0.182
apom
-0.069
AL954142.1
0.180
LOC110437731
-0.069
LOC101882480
0.176
ahsg1
-0.069
lmo7b
0.176
gda
-0.069
si:ch73-208h1.1
0.175
agxtb
-0.068
si:ch211-150d5.3
0.172
f7i
-0.068
si:dkeyp-80c12.4
0.171
apoa2
-0.067
opn1mw4
0.170
c9
-0.067
FO393424.2
0.167
ucp1
-0.067
CR854989.1
0.162
cbln9
-0.067
smpx
0.159
ambp
-0.067
sox8b
0.157
si:ch211-113d11.5
-0.066
plcg2
0.156
cyp2n13
-0.065
si:dkeyp-70f9.7
0.152
serpina1
-0.065
svila
0.151
si:dkey-86l18.10
-0.065
cycsb
0.151
gpx3
-0.065
pik3r5
0.151
c3a.3
-0.065
dut
0.149
apoba
-0.065
si:ch211-160d14.15
0.147
itih3a
-0.065
LOC108179280
0.146
fn1b
-0.064
LOC108180123
0.146
rnasel3
-0.064
C1orf232
0.145
tfa
-0.064