Daniocell
bcas3 (ionocytes / mucous-producing)
BCAS3 microtubule associated cell migration factor
ZFIN
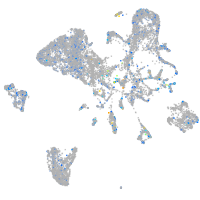
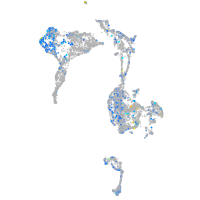
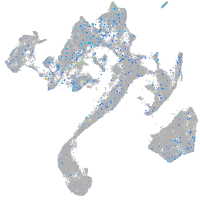
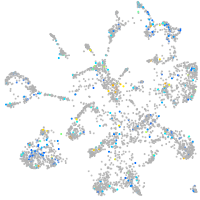
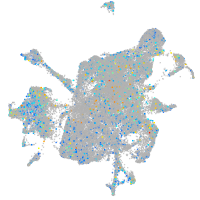
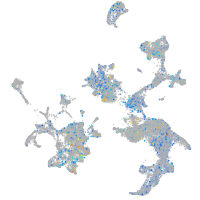
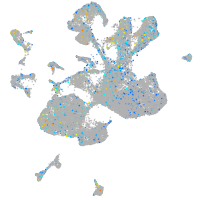
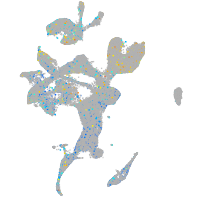
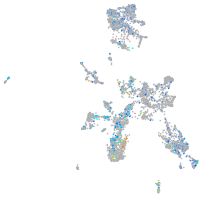
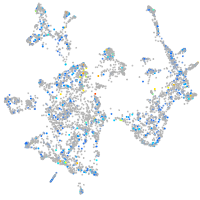
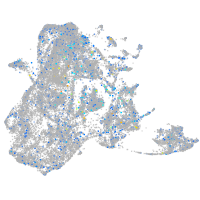
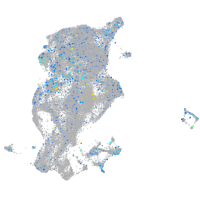
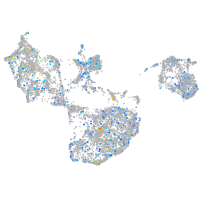
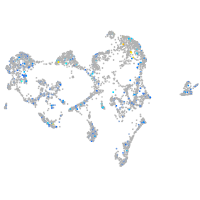
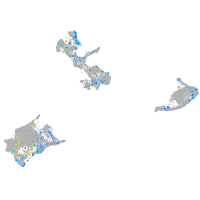
Gene expression UMAP
Display:
Expression
Stage
Other cell groups
all cells
blastomeres
PGCs
endoderm
axial mesoderm
muscle
mural cells /
non-skeletal muscle
mesenchyme
hematopoietic /
vasculature
pronephros
neural
spinal cord / glia
eye
taste / olfactory
otic / lateral line
epidermis
periderm
fin
ionocytes / mucous
pigment cells
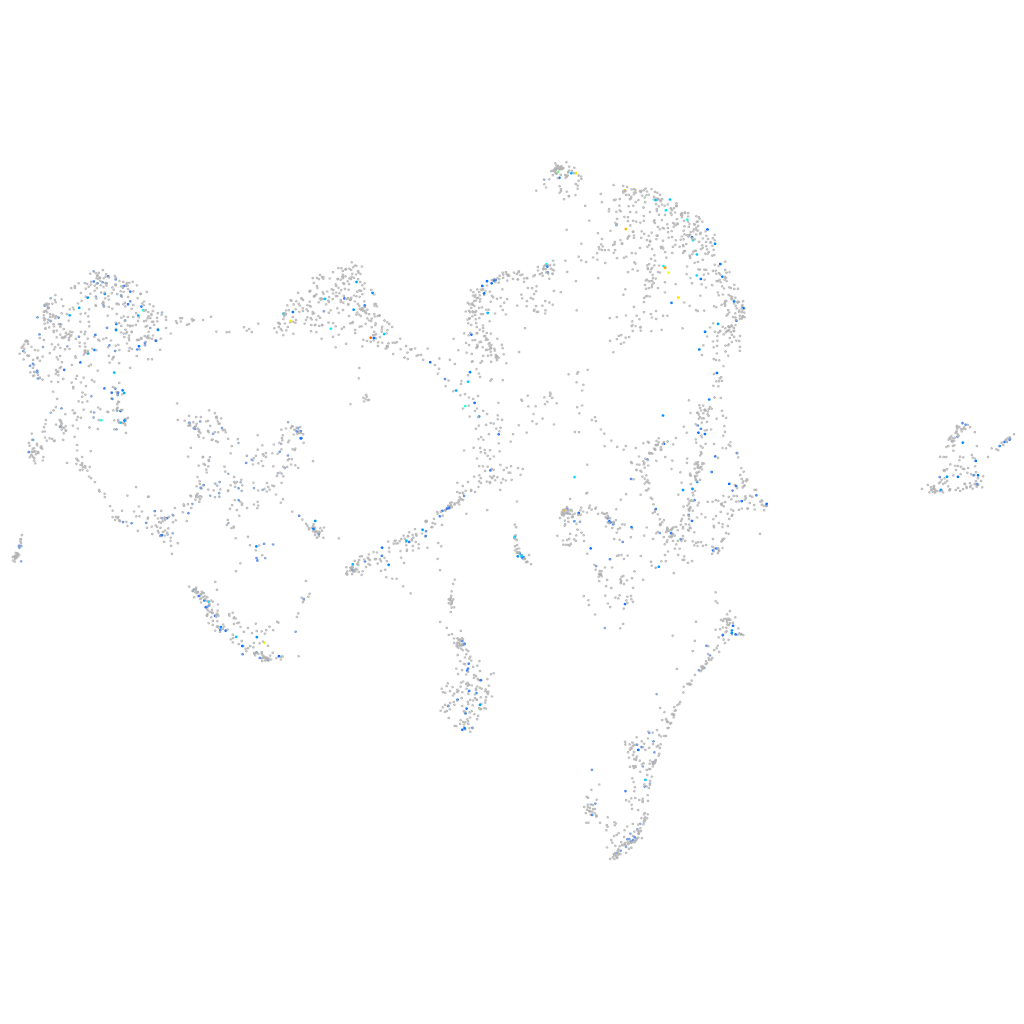
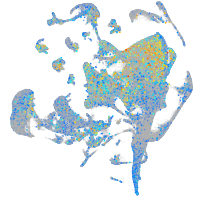
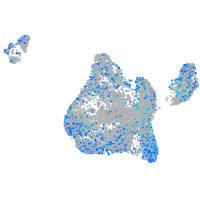
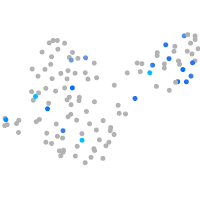
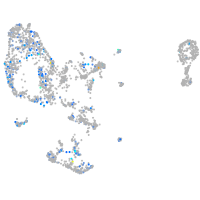
Expression by stage/cluster
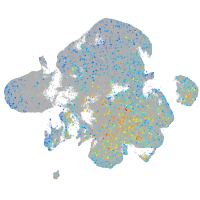
Correlated gene expression
Positive correlation
Negative correlation
Gene
r
Gene
r
scn5lab
0.173
calm2b
-0.060
si:dkey-205h23.2
0.169
tmem97
-0.059
LOC110439834
0.169
anxa11b
-0.059
nrxn1b
0.166
hmgn2
-0.058
XLOC-002665
0.165
snrpb
-0.056
LOC100536716
0.160
cd2bp2
-0.053
syngap1a
0.159
si:ch211-166a6.5
-0.053
ndufa4l2a
0.157
si:ch211-202f5.3
-0.052
cacnb3a
0.156
psma4
-0.051
si:dkey-20i20.3
0.152
bcap29
-0.051
pex5la
0.151
myl12.1
-0.050
CABZ01076968.1
0.148
pvalb2
-0.050
crygm2d14
0.146
cops4
-0.050
selenoo2
0.146
lsm7
-0.050
kif25
0.145
phb2b
-0.050
si:ch211-106a19.1
0.145
prelid3b
-0.050
trim35-13
0.145
rab5c
-0.050
LOC101883820
0.144
zgc:162730
-0.050
cspp1a
0.143
h2afvb
-0.050
ptprr
0.142
arpc3
-0.049
BX640584.1
0.142
srsf3b
-0.049
gig2i
0.141
mt-nd1
-0.048
LOC108182922
0.140
plcd1a
-0.048
LOC110439439
0.140
tufm
-0.048
tbx6
0.140
eif4eb
-0.048
MSANTD2
0.138
snrpd1
-0.048
slc16a2
0.138
abce1
-0.048
si:ch211-255g12.8
0.138
copb2
-0.047
ssh1b
0.138
zgc:194246
-0.047
grm2b
0.138
srp9
-0.047
scn1laa
0.130
tmem11
-0.047
LOC101887092
0.128
api5
-0.047
BX005450.1
0.127
pmm2
-0.046
kcnj12b
0.126
hnrnpa0b
-0.046
ccl39.2
0.124
si:dkey-12j5.1
-0.046