Daniocell
bbx (periderm)
BBX high mobility group box domain containing
ZFIN
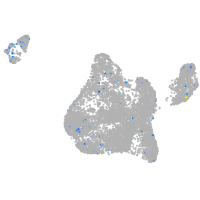
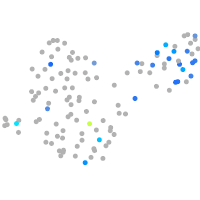
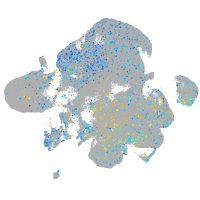
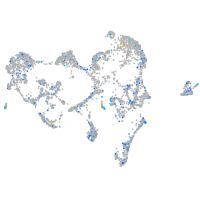
Gene expression UMAP
Display:
Expression
Stage
Other cell groups
all cells
blastomeres
PGCs
endoderm
axial mesoderm
muscle
mural cells /
non-skeletal muscle
mesenchyme
hematopoietic /
vasculature
pronephros
neural
spinal cord / glia
eye
taste / olfactory
otic / lateral line
epidermis
periderm
fin
ionocytes / mucous
pigment cells
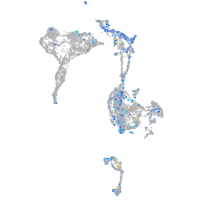
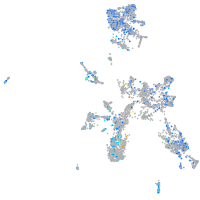
Expression by stage/cluster
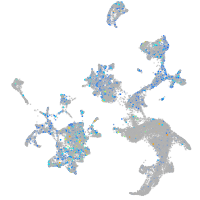
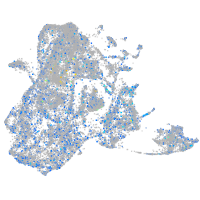
Correlated gene expression
Positive correlation
Negative correlation
Gene
r
Gene
r
si:ch211-223g7.6
0.076
krt4
-0.069
lrp2bp
0.074
krt5
-0.063
CR383676.1
0.074
agr1
-0.056
LO017682.1
0.073
cyt1l
-0.053
XLOC-033414
0.073
zgc:193505
-0.051
mt-co2
0.073
cyt1
-0.048
MAJIN
0.072
s100a10b
-0.046
klhl24b
0.072
s100w
-0.045
CU633479.1
0.071
si:dkey-16p21.8
-0.043
si:dkey-222h21.7
0.071
si:ch211-195b11.3
-0.042
COX3
0.068
krt17
-0.042
LOC110438259
0.068
wu:fb18f06
-0.040
CABZ01085710.1
0.068
gsta.1
-0.040
mt-cyb
0.067
cst14b.1
-0.039
si:dkey-262k9.2
0.067
cfl1l
-0.038
CABZ01061495.1
0.067
icn
-0.033
elfn2a
0.066
si:ch211-157c3.4
-0.033
mt-co1
0.065
zgc:175088
-0.032
ddit3
0.064
gstp1
-0.032
or111-7
0.063
capns1a
-0.031
BX957322.3
0.062
ahcy
-0.031
CR392036.1
0.062
tgm1l4
-0.030
BX470154.1
0.062
anxa1c
-0.030
edn2
0.061
krt92
-0.030
nptxra
0.061
cyp2y3
-0.029
radil
0.060
dynll1
-0.029
wdr95
0.059
icn2
-0.029
nwd1
0.059
capns1b
-0.029
LOC101884182
0.058
zgc:153867
-0.029
nt5c2b
0.057
scinla
-0.028
LOC110438280
0.057
ANXA1 (1 of many)
-0.028
LOC100149223
0.057
anxa1a
-0.027
ugt8
0.057
mapre1a
-0.027
SMIM18
0.056
anxa2a
-0.027
ush1ga
0.056
capn9
-0.025