Daniocell
bbs12 (pigment cells)
Bardet-Biedl syndrome 12
ZFIN
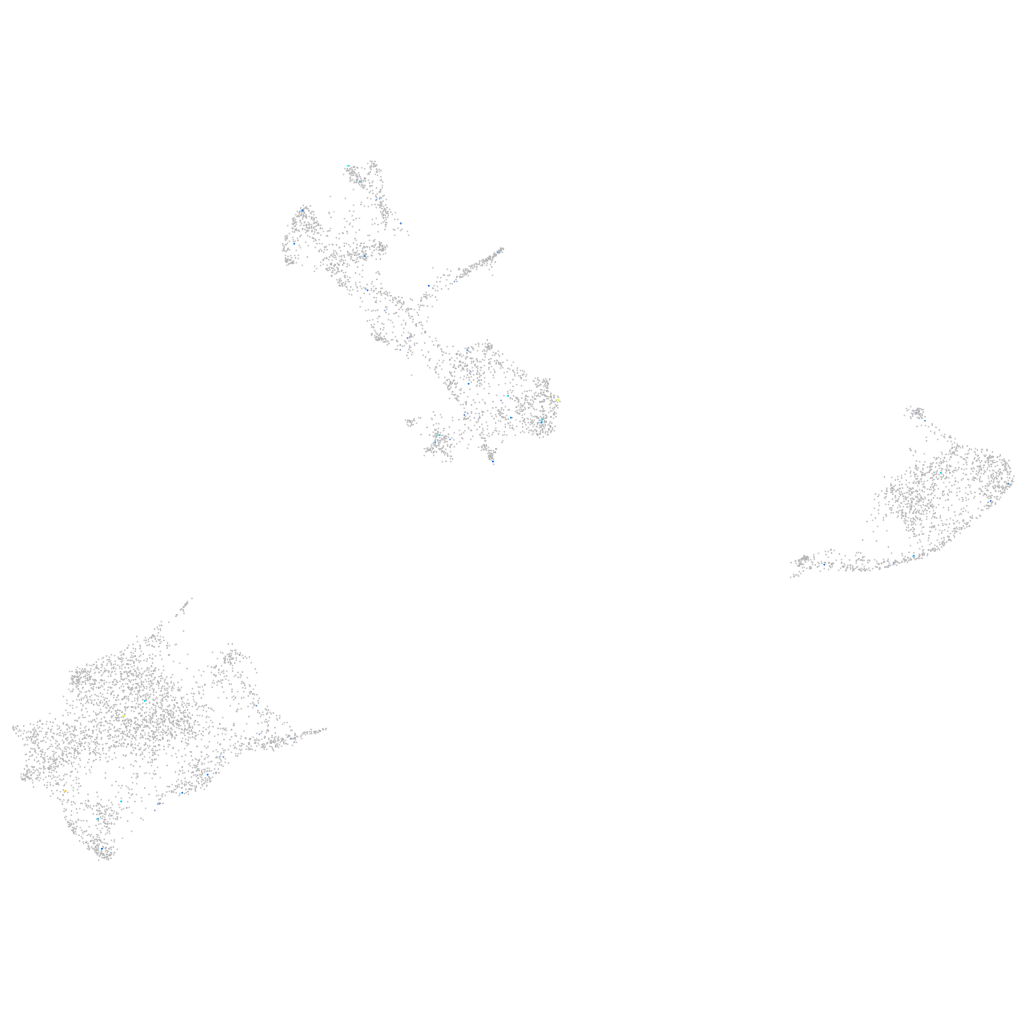
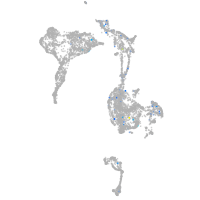
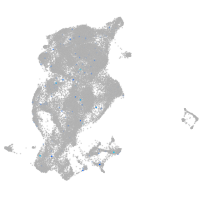
Gene expression UMAP
Display:
Expression
Stage
Other cell groups
all cells
blastomeres
PGCs
endoderm
axial mesoderm
muscle
mural cells /
non-skeletal muscle
mesenchyme
hematopoietic /
vasculature
pronephros
neural
spinal cord / glia
eye
taste / olfactory
otic / lateral line
epidermis
periderm
fin
ionocytes / mucous
pigment cells
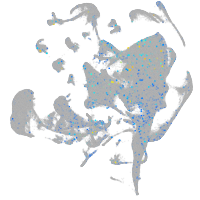
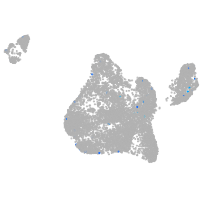
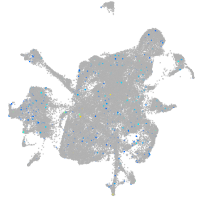
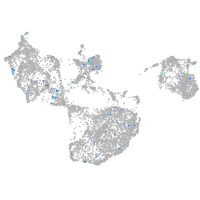
Expression by stage/cluster
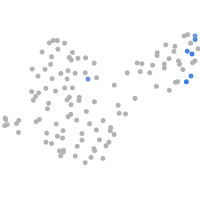
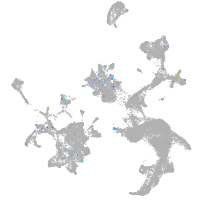
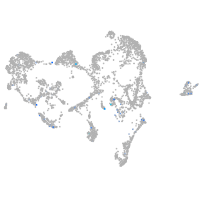
Correlated gene expression
Positive correlation
Negative correlation
Gene
r
Gene
r
LOC103911664
0.294
actc1b
-0.032
CU394253.1
0.273
pts
-0.030
si:ch211-87j1.4
0.223
gch2
-0.025
CU627988.1
0.207
ywhaz
-0.024
TMC1
0.202
actb2
-0.024
CR382383.2
0.200
akr1b1
-0.024
ungb
0.200
mylpfb
-0.024
XLOC-023279
0.200
rpl3
-0.023
ftr02
0.198
si:ch211-114n24.6
-0.023
ros1
0.195
cotl1
-0.022
trim35-33
0.182
prdx1
-0.022
XLOC-027111
0.177
pfn1
-0.022
grpr
0.170
atp6v1f
-0.022
si:ch211-149a19.3
0.167
qdpra
-0.021
CU571398.1
0.165
icn2
-0.021
echdc1
0.164
snx1a
-0.021
amh
0.163
syngr1a
-0.021
BX649384.2
0.162
cfl1
-0.021
RF00263
0.162
si:dkey-251i10.2
-0.021
si:ch73-41e3.7
0.162
CABZ01032488.1
-0.020
si:ch73-144d13.5
0.160
si:dkey-151g10.6
-0.020
si:dkey-217f16.5
0.160
prdx5
-0.020
adrb1
0.155
hbbe3
-0.020
CT009487.2
0.155
vps26c
-0.020
xkr6a
0.151
rplp2l
-0.019
spi2
0.141
cct4
-0.019
qsox1
0.138
gstp1
-0.019
inpp5kb
0.135
usp5
-0.019
LO018585.1
0.132
cstf2
-0.019
LOC110438002
0.129
myhz1.2
-0.019
BX511259.1
0.126
hsp90ab1
-0.019
si:ch211-209a2.2
0.126
myl10
-0.019
si:dkey-238d18.3
0.125
atp5pf
-0.019
LOC100535806
0.125
pvalb4
-0.019
BX908750.1
0.124
rabac1
-0.018