Daniocell
babam2 (ionocytes / mucous-producing)
BRISC and BRCA1 A complex member 2
ZFIN
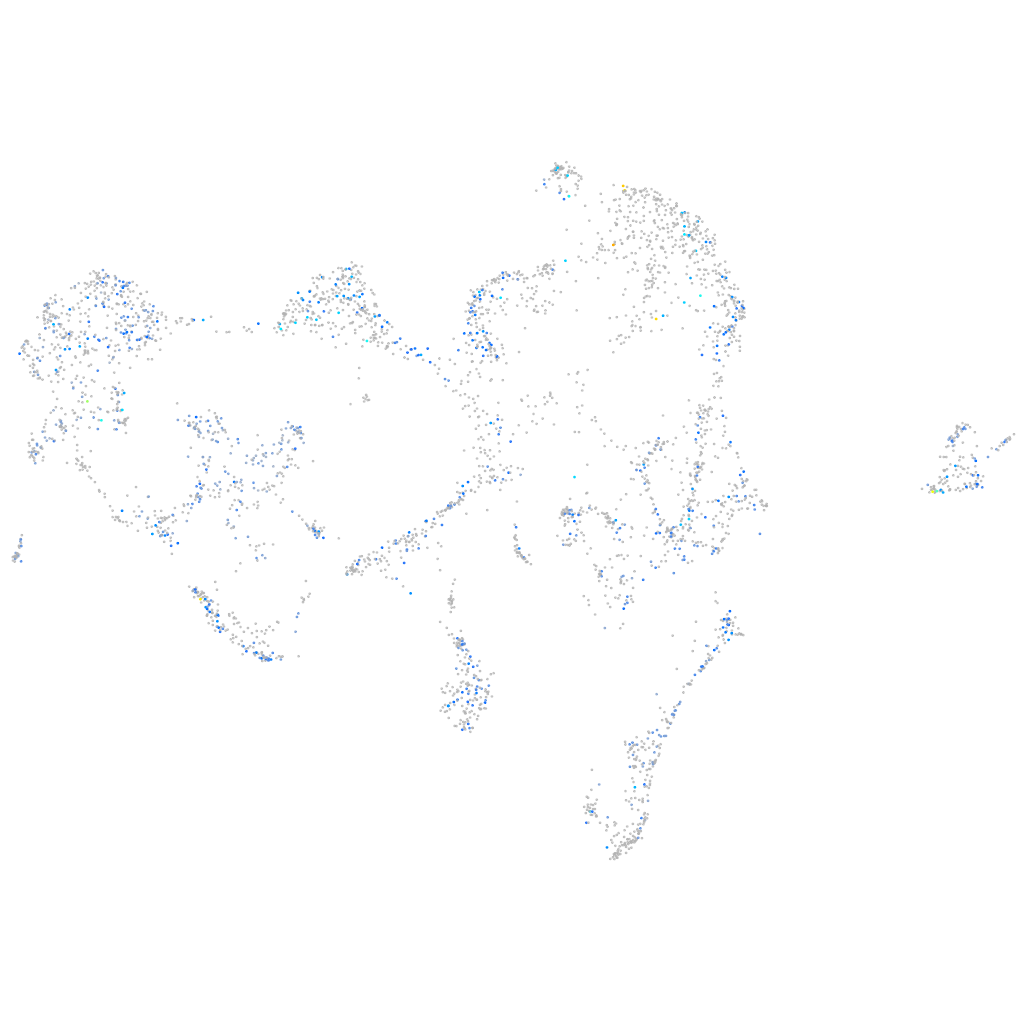
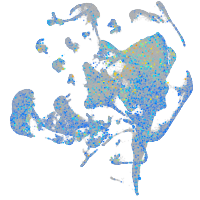
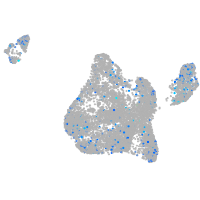
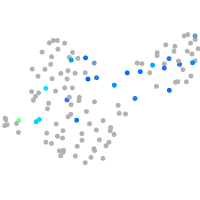
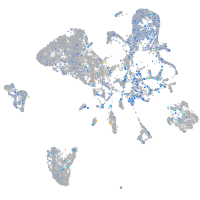
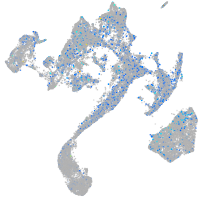
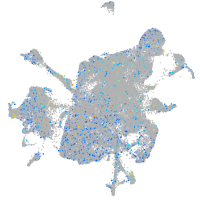
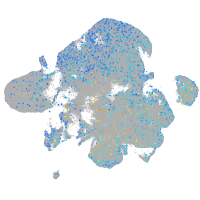
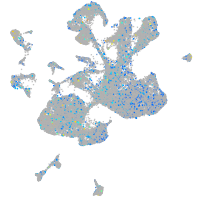
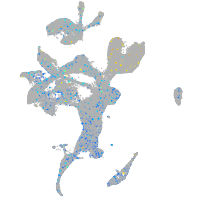
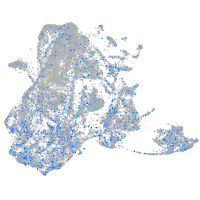
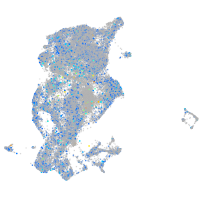
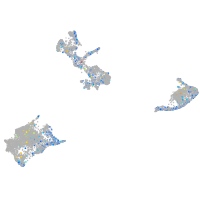
Gene expression UMAP
Display:
Expression
Stage
Other cell groups
all cells
blastomeres
PGCs
endoderm
axial mesoderm
muscle
mural cells /
non-skeletal muscle
mesenchyme
hematopoietic /
vasculature
pronephros
neural
spinal cord / glia
eye
taste / olfactory
otic / lateral line
epidermis
periderm
fin
ionocytes / mucous
pigment cells
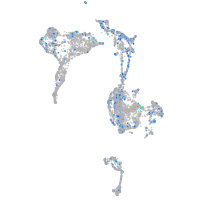
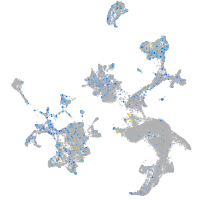
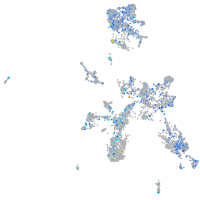
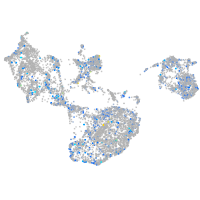
Expression by stage/cluster
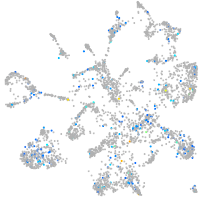
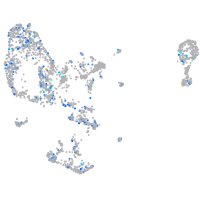
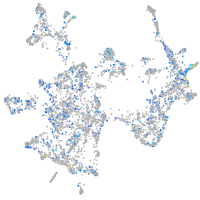
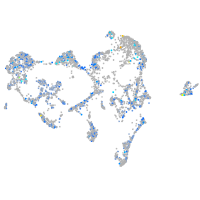
Correlated gene expression
Positive correlation
Negative correlation
Gene
r
Gene
r
LOC103910453
0.144
agr2
-0.053
slc2a15b
0.144
zgc:92380
-0.052
tmem182a
0.139
col1a1b
-0.051
BX640584.1
0.124
si:dkey-65b12.6
-0.050
cort
0.122
zgc:101744
-0.050
scmh1
0.121
zgc:136930
-0.050
si:dkey-27n6.1
0.117
krt5
-0.049
zbtb24
0.109
CR855337.1
-0.048
kif6
0.108
col17a1a
-0.048
ccl39.2
0.107
mylpfb
-0.046
plcb3
0.106
gab2
-0.046
si:cabz01071907.1
0.104
col14a1b
-0.046
LOC100536045
0.104
muc5.1
-0.045
ctsd
0.104
gamt
-0.044
osbpl11
0.103
si:dkey-95h12.1
-0.044
BX005048.1
0.103
nansb
-0.043
nrn1la
0.103
fam83fa
-0.043
ywhabl
0.101
dnajc10
-0.043
entpd8
0.101
LOC110438378
-0.042
XLOC-011926
0.101
atp2a3
-0.042
TC2N
0.100
myl13
-0.041
rpgrb
0.100
mir181b-3
-0.041
LOC103909513
0.099
si:dkey-183i3.5
-0.041
LOC103910909
0.099
si:dkey-93m18.4
-0.041
or134-1
0.099
col1a2
-0.040
ampd1
0.098
smdt1a
-0.040
si:ch211-114l13.4
0.098
rbp4
-0.040
trim35-19
0.097
muc5.2
-0.040
si:dkey-30j22.1
0.096
timp2a
-0.039
ptger2a
0.096
gas2l1
-0.039
megf8l
0.096
rpl38
-0.038
hrasls
0.096
col2a1b
-0.038
f11r.1
0.096
postnb
-0.038
si:ch1073-429i10.3.1
0.096
zgc:112994
-0.038
XLOC-040040
0.095
scin
-0.038