
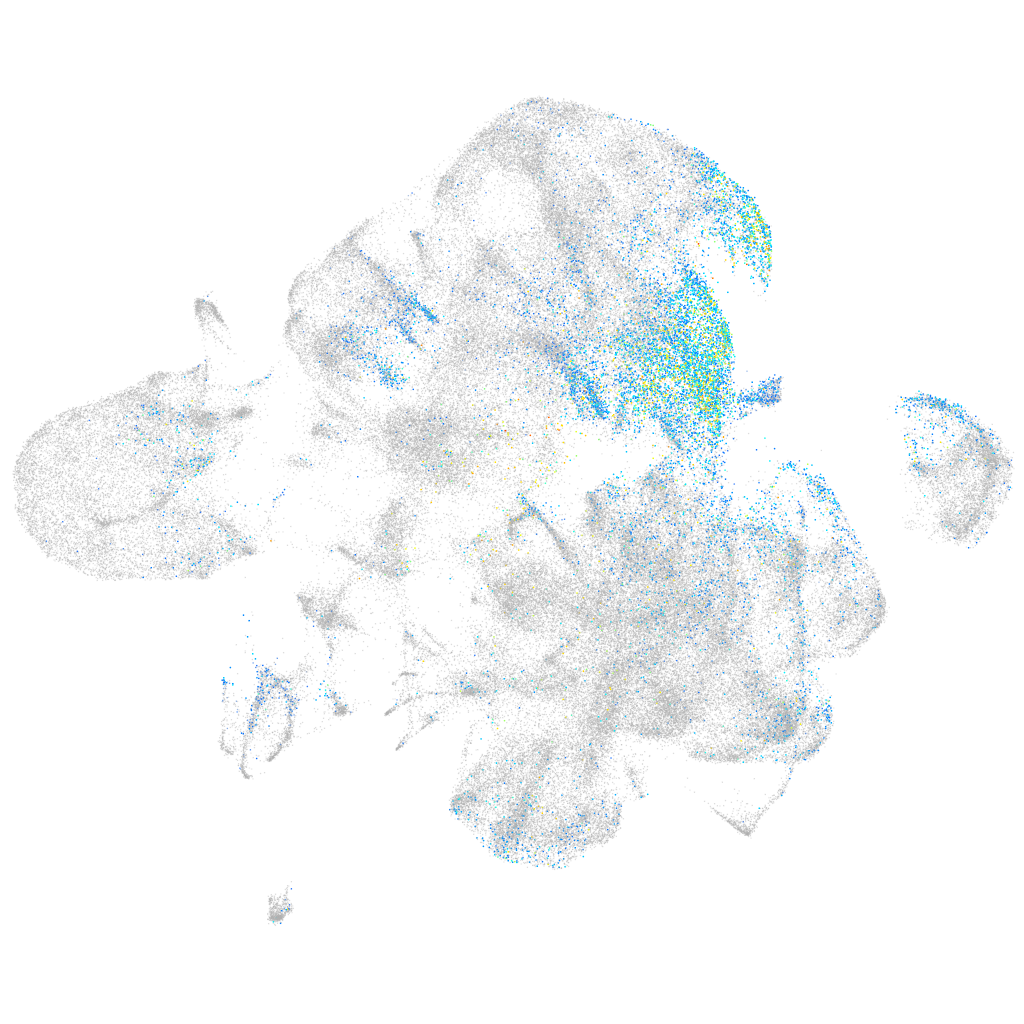
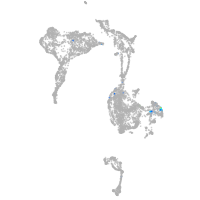
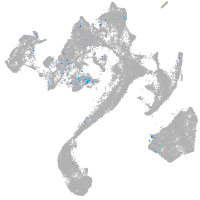
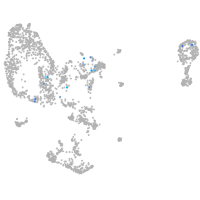
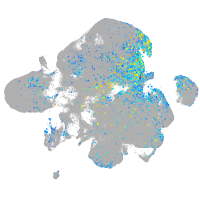
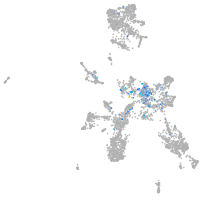
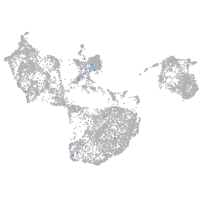
Gene expression UMAP


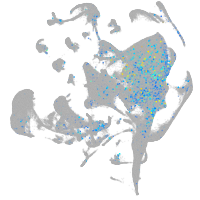

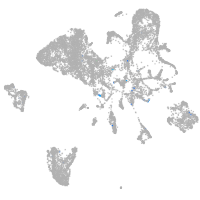

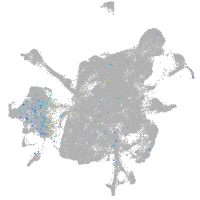
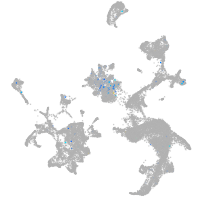
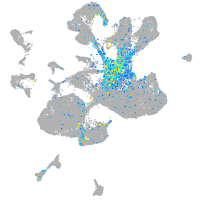
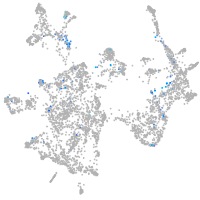
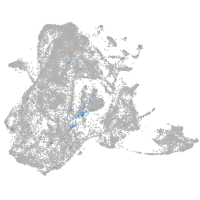
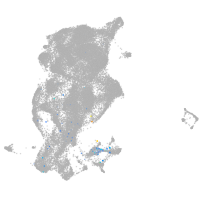
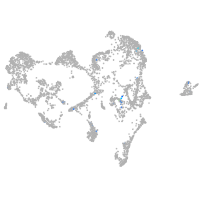
Expression by stage/cluster
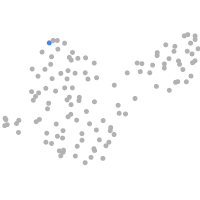
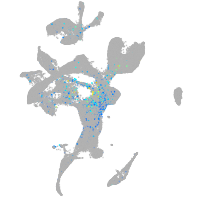
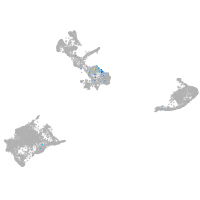
Correlated gene expression
| Positive correlation | Negative correlation | ||
| Gene | r | Gene | r |
| gadd45gb.1 | 0.499 | ncl | -0.118 |
| dlb | 0.443 | sncb | -0.112 |
| dla | 0.406 | rtn1b | -0.111 |
| neurod4 | 0.375 | gng3 | -0.109 |
| LOC798783 | 0.370 | hmgn7 | -0.107 |
| fstl1a | 0.366 | cnbpb | -0.106 |
| her13 | 0.348 | npm1a | -0.105 |
| insm1a | 0.343 | ywhaz | -0.105 |
| ebf2 | 0.342 | stmn2a | -0.104 |
| cep131 | 0.330 | calm2a | -0.103 |
| sertad2a | 0.325 | h2afy2 | -0.103 |
| notch1a | 0.321 | gapdhs | -0.102 |
| cdkn1ca | 0.314 | ywhag2 | -0.101 |
| im:7152348 | 0.313 | calm2b | -0.099 |
| inavaa | 0.305 | dkc1 | -0.098 |
| insm1b | 0.276 | zgc:65894 | -0.098 |
| sox11b | 0.268 | stx1b | -0.096 |
| dld | 0.266 | snap25a | -0.095 |
| pcdh18b | 0.261 | atp6v0cb | -0.094 |
| plk3 | 0.260 | nop58 | -0.094 |
| srrm4 | 0.259 | ldhba | -0.094 |
| rtca | 0.258 | fbl | -0.094 |
| nhlh2 | 0.255 | tpi1b | -0.093 |
| scrt2 | 0.254 | cbx1b | -0.093 |
| XLOC-003692 | 0.249 | elavl4 | -0.092 |
| abhd6a | 0.248 | map1aa | -0.091 |
| zbtb18 | 0.239 | gpm6ab | -0.091 |
| myt1a | 0.237 | gap43 | -0.088 |
| tp53inp2 | 0.235 | tmsb2 | -0.088 |
| rhbdl3 | 0.234 | ywhaqa | -0.088 |
| smad3a | 0.234 | syt1a | -0.087 |
| hes6 | 0.233 | atp1b3a | -0.086 |
| gpm6bb | 0.233 | atp5if1b | -0.086 |
| syne2b | 0.230 | sypb | -0.086 |
| her4.2 | 0.227 | c1qbp | -0.085 |