Daniocell
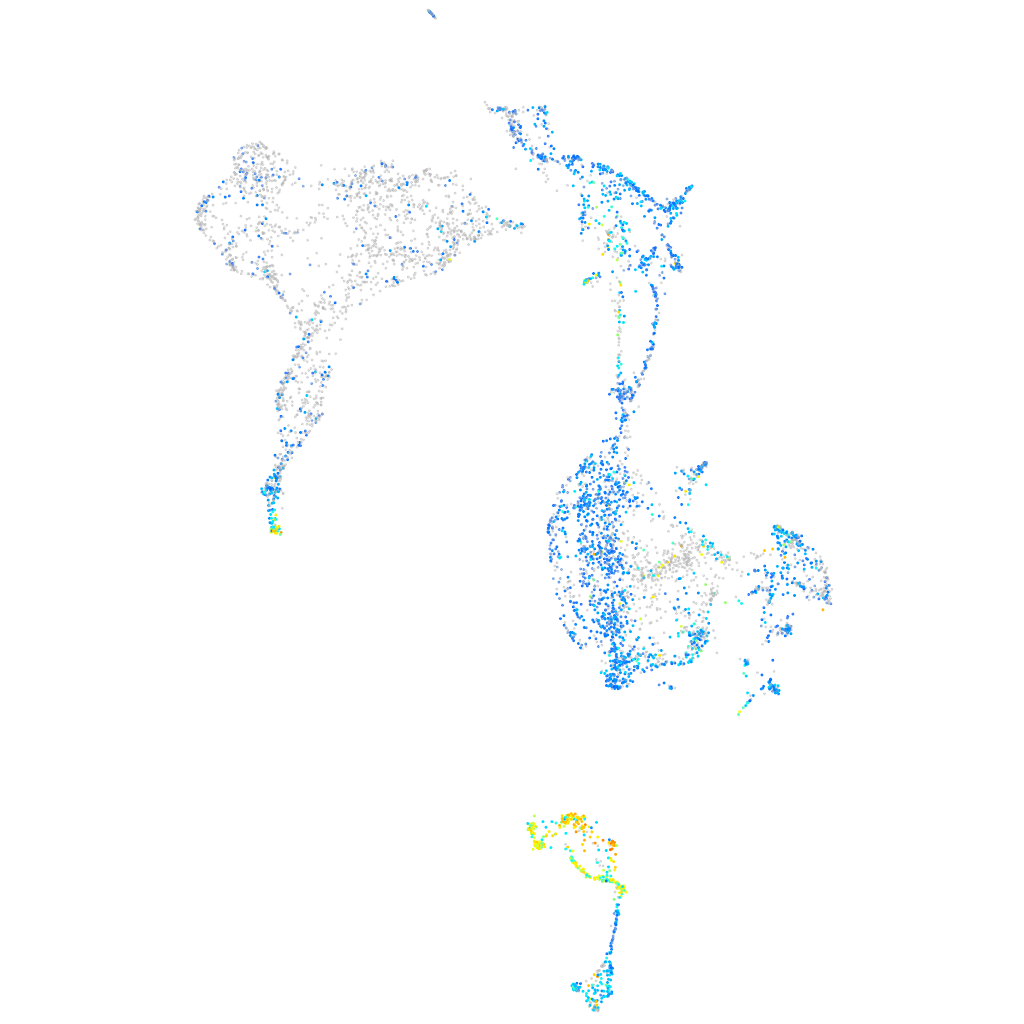
atp5if1b (axial mesoderm)
ATP synthase inhibitory factor subunit 1b
ZFIN
Gene expression UMAP
Display:
Expression
Stage
Other cell groups
all cells
blastomeres
PGCs
endoderm
axial mesoderm
muscle
mural cells /
non-skeletal muscle
mesenchyme
hematopoietic /
vasculature
pronephros
neural
spinal cord / glia
eye
taste / olfactory
otic / lateral line
epidermis
periderm
fin
ionocytes / mucous
pigment cells
Expression by stage/cluster
Correlated gene expression
Positive correlation
Negative correlation
Gene
r
Gene
r
zgc:92380
0.535
NC-002333.4
-0.415
si:dkey-26g8.5
0.527
hnrnpub
-0.403
si:dkey-239j18.3
0.504
marcksb
-0.398
si:dkey-269i1.4
0.501
nucks1a
-0.391
cd63
0.496
top1l
-0.388
si:dkey-269i1.3
0.494
hnrnpa1b
-0.384
ctslb
0.493
acin1a
-0.376
si:dkey-239j18.2
0.491
seta
-0.376
he1.1
0.490
brd3a
-0.370
wu:fa26c03
0.490
stm
-0.370
he1.2
0.471
hnrnpm
-0.369
svopl
0.468
rbm4.3
-0.367
si:dkey-26g8.4
0.467
hnrnpa1a
-0.364
hopx
0.458
ptmab
-0.362
cst14a.2
0.457
khdrbs1a
-0.362
s100v2
0.453
snrnp70
-0.361
si:ch211-226m16.2
0.448
si:ch211-288g17.3
-0.359
capn2b
0.444
anp32a
-0.358
dnase1l1
0.441
si:ch211-152c2.3
-0.357
cldnh
0.440
ppig
-0.357
zgc:56493
0.440
safb
-0.356
rnf183
0.438
hnrnpabb
-0.356
zgc:174153
0.434
hmgb2b
-0.352
si:dkey-222f8.3
0.430
marcksl1b
-0.352
rcvrn2
0.428
ilf3b
-0.348
rplp0
0.427
hnrnpl
-0.345
malb
0.427
snrpa
-0.345
timp4.1
0.426
cbx3a
-0.342
uqcc3
0.426
srsf1a
-0.341
sb:cb470
0.426
taf15
-0.341
rpl19
0.421
syncrip
-0.341
si:dkey-204f11.64
0.419
hnrnpa0b
-0.340
pfn1
0.415
smc1al
-0.340
rps17
0.413
akap12b
-0.339
foxe3
0.408
cirbpa
-0.339