Daniocell
atg4c (mesenchyme)
"autophagy related 4C, cysteine peptidase"
ZFIN
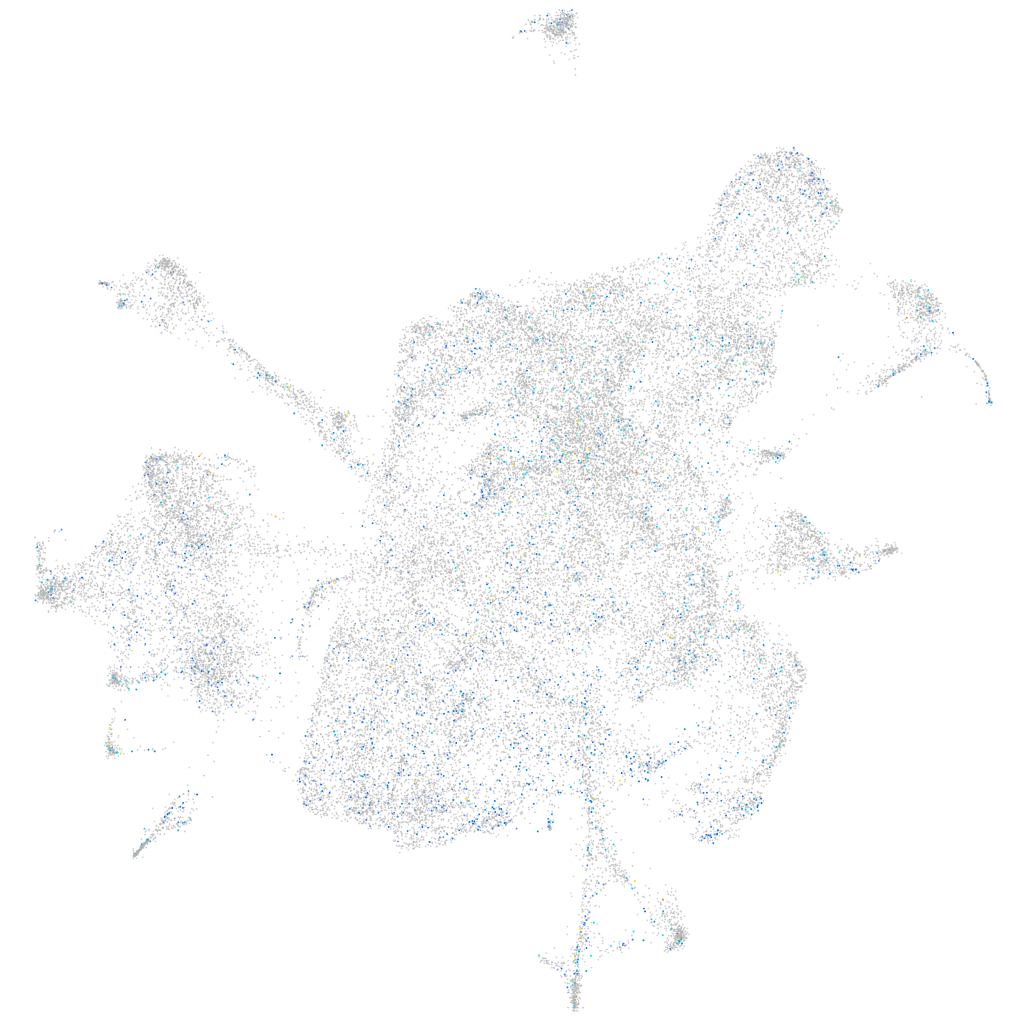
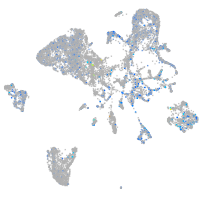
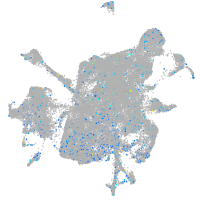
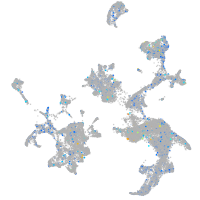
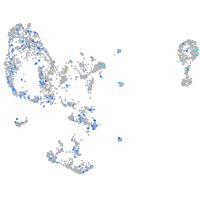
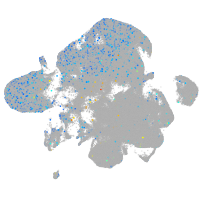
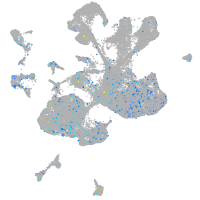
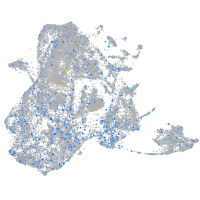
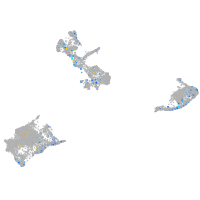
Gene expression UMAP
Display:
Expression
Stage
Other cell groups
all cells
blastomeres
PGCs
endoderm
axial mesoderm
muscle
mural cells /
non-skeletal muscle
mesenchyme
hematopoietic /
vasculature
pronephros
neural
spinal cord / glia
eye
taste / olfactory
otic / lateral line
epidermis
periderm
fin
ionocytes / mucous
pigment cells
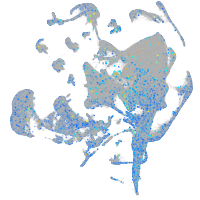
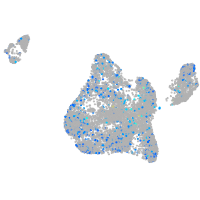
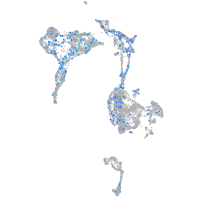
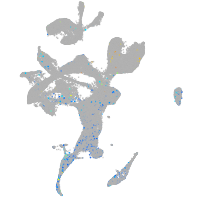
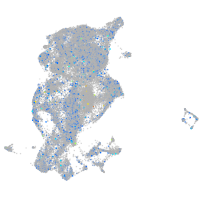
Expression by stage/cluster
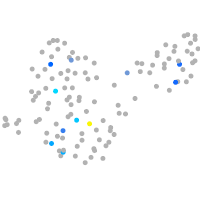
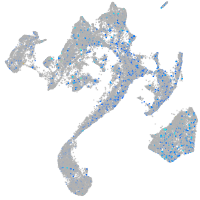
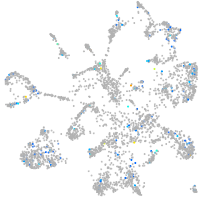
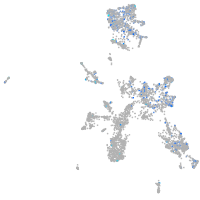
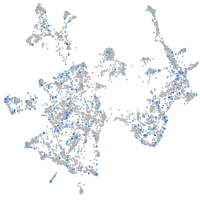
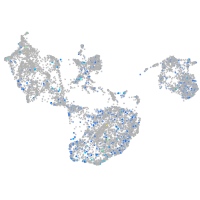
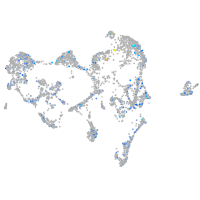
Correlated gene expression
Positive correlation
Negative correlation
Gene
r
Gene
r
BX640537.1
0.060
rps29
-0.038
LOC796088
0.054
rpl37
-0.033
si:dkey-32n7.8
0.052
rpl38
-0.032
vamp3
0.045
rpl29
-0.031
zgc:158423
0.043
rplp1
-0.031
XLOC-026773
0.043
rps28
-0.030
myl4
0.043
si:dkey-151g10.6
-0.028
glulb
0.042
rpl39
-0.026
adprhl1
0.042
rps21
-0.023
CR377211.3
0.042
rplp2l
-0.021
atp1b4
0.042
rpl36a
-0.020
LOC108183297
0.041
rps25
-0.019
akap12b
0.041
tars
-0.016
apof
0.040
dlx5a
-0.016
si:dkeyp-106c3.1
0.040
dlx4a
-0.015
XLOC-015765
0.040
rpl27a
-0.014
si:ch211-160d14.15
0.040
ckmb
-0.014
si:ch211-163c2.1
0.040
klf15
-0.014
LOC103908740
0.040
adgrl3.1
-0.014
aldoaa
0.039
scinla
-0.013
XLOC-026554
0.039
zgc:73359
-0.013
si:ch211-286b5.5
0.039
postna
-0.013
XLOC-001992
0.039
rpl31
-0.013
flot2a
0.039
hrc
-0.013
si:dkey-238d18.3
0.039
adgrd1
-0.013
txnipa
0.038
dync1i1
-0.013
fabp11a
0.038
scrt1a
-0.013
ubc
0.037
dclk1b
-0.013
igfbp2a
0.037
stmn1b
-0.013
zic2a
0.037
pou3f3b
-0.012
si:ch211-256e16.4
0.037
CELA1 (1 of many)
-0.012
wls
0.036
rpl35a
-0.012
gabarapb
0.036
plxna2
-0.012
tpm4a
0.036
si:dkey-7c18.24
-0.012
or116-2
0.036
ccka
-0.012