Daniocell
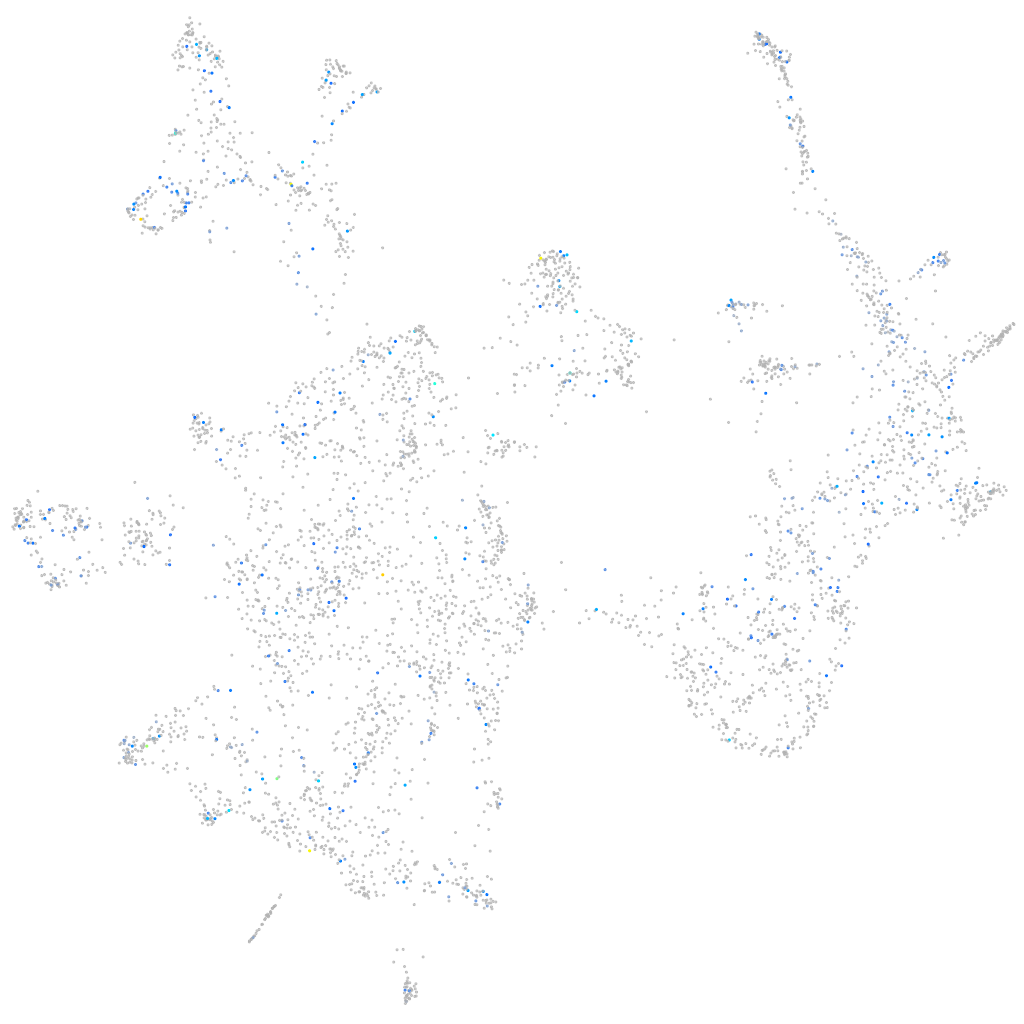
atg16l1 (otic / lateral line)
ATG16 autophagy related 16-like 1 (S. cerevisiae)
ZFIN
Gene expression UMAP
Display:
Expression
Stage
Other cell groups
all cells
blastomeres
PGCs
endoderm
axial mesoderm
muscle
mural cells /
non-skeletal muscle
mesenchyme
hematopoietic /
vasculature
pronephros
neural
spinal cord / glia
eye
taste / olfactory
otic / lateral line
epidermis
periderm
fin
ionocytes / mucous
pigment cells
Expression by stage/cluster
Correlated gene expression
Positive correlation
Negative correlation
Gene
r
Gene
r
hspb2
0.175
si:dkey-151g10.6
-0.073
dsg2l
0.151
rpl39
-0.070
si:dkey-172k15.4
0.150
rpl37
-0.066
si:dkey-246j6.3
0.150
sparc
-0.064
LOC101887019
0.148
stm
-0.064
LOC110439128.1
0.148
rpl29
-0.063
cryba1a
0.148
rps19
-0.063
slc22a4
0.135
rpl38
-0.061
si:ch211-209a2.2
0.134
rps20
-0.061
LOC108190486
0.132
rps28
-0.061
LOC110437767
0.127
otomp
-0.061
RIC3
0.125
rplp1
-0.060
LOC100149554.1
0.125
agr2
-0.058
si:ch211-234p6.9
0.124
rpl28
-0.057
gabrr1
0.124
rps27.1
-0.057
si:dkey-234i14.2
0.121
rps24
-0.057
zmp:0000000984
0.121
rpl35
-0.055
gsg1l2a
0.120
rps23
-0.054
RF01296
0.119
rps21
-0.054
LOC110440222
0.117
rpl26
-0.053
nkpd1
0.117
rpl21
-0.053
FP015808.1
0.116
rpl27a
-0.052
cacng6b
0.116
rpl24
-0.052
strip2
0.115
rpl31
-0.051
pcp4a
0.115
rps2
-0.051
znf1121
0.114
rpl35a
-0.051
ugt5e1
0.114
rbp5
-0.050
tll1
0.112
rpl14
-0.050
MAPK8IP1 (1 of many)
0.110
rpl36a
-0.050
si:ch73-21k16.5
0.110
rpl12
-0.049
mfsd2b
0.108
tmsb4x
-0.049
si:dkeyp-80c12.5
0.108
rplp2l
-0.049
adgre9
0.107
rps11
-0.049
si:ch1073-174d20.2
0.106
eef1a1l1
-0.048
RNF157
0.106
rpl8
-0.048