Daniocell
asb6 (mural cells / non-skeletal muscle)
ankyrin repeat and SOCS box containing 6
ZFIN
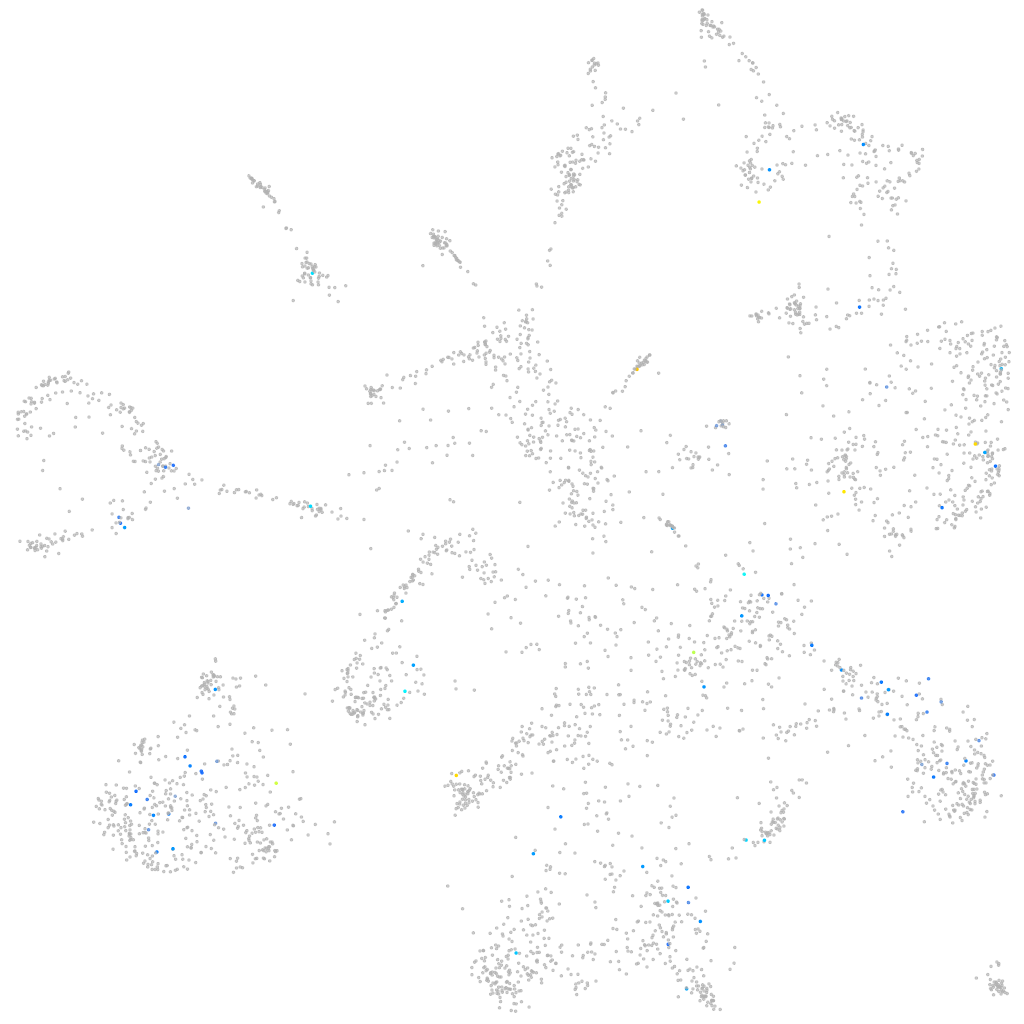
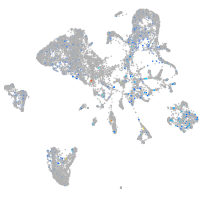
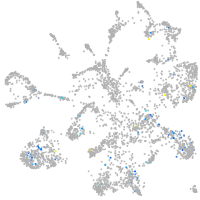
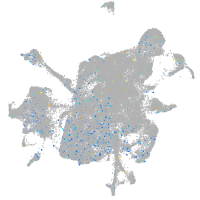
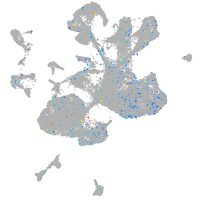
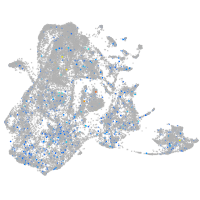
Gene expression UMAP
Display:
Expression
Stage
Other cell groups
all cells
blastomeres
PGCs
endoderm
axial mesoderm
muscle
mural cells /
non-skeletal muscle
mesenchyme
hematopoietic /
vasculature
pronephros
neural
spinal cord / glia
eye
taste / olfactory
otic / lateral line
epidermis
periderm
fin
ionocytes / mucous
pigment cells
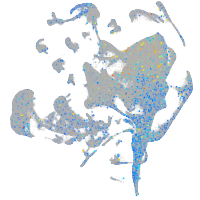
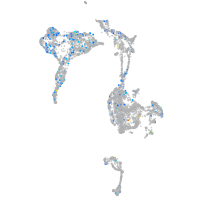
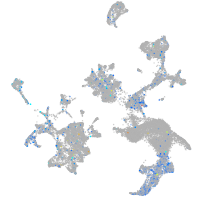
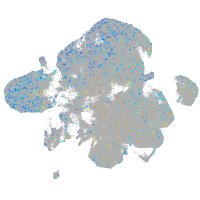
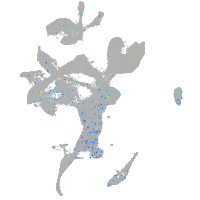
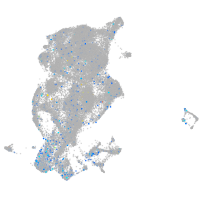
Expression by stage/cluster
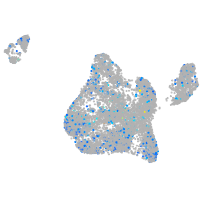
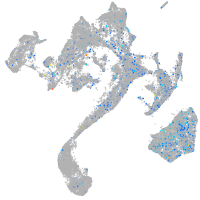
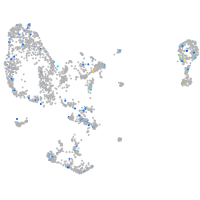
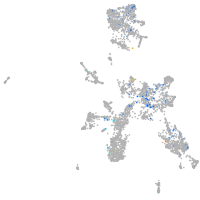
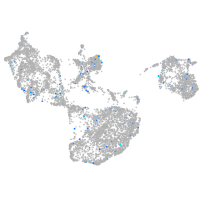
Correlated gene expression
Positive correlation
Negative correlation
Gene
r
Gene
r
si:dkey-45h7.1
0.300
tmsb4x
-0.056
si:dkey-22p6.2
0.243
tpm4b
-0.041
LOC108179500
0.239
cebpd
-0.040
si:dkey-111i23.1
0.233
id3
-0.037
gyg2
0.226
mxd4
-0.037
si:dkey-16p19.8
0.224
cdkn1d
-0.036
slc22a6l
0.221
twist1a
-0.035
LOC110437723
0.206
chac1
-0.035
LOC108183925
0.205
tmem204
-0.035
si:dkey-22f5.9
0.197
tpma
-0.035
anpepa
0.192
tnni2a.4
-0.035
eva1c
0.173
si:dkey-57k2.6
-0.034
LOC100151196
0.173
zfp36l2
-0.034
BX005060.1
0.172
loxa
-0.034
caprin2
0.171
egr1
-0.034
nmbr
0.171
rasl11a
-0.033
CABZ01012382.1
0.168
ctrb1
-0.033
si:dkey-238k10.2
0.163
CELA1 (1 of many)
-0.033
LOC103910773
0.157
nfkbiaa
-0.033
LOC110437985
0.154
akap12b
-0.032
ENKD1
0.152
c7a
-0.032
XLOC-044110
0.144
ier2b
-0.032
LOC101885705.1
0.143
rplp2
-0.032
znf1102
0.141
crip1
-0.032
si:ch73-139e5.4
0.140
sesn3
-0.032
kcnk1a
0.138
prss59.1
-0.031
si:dkey-14o6.1
0.136
ifitm1
-0.031
LOC100333163
0.135
tob1b
-0.031
ftr91
0.132
lpp
-0.030
mir29a-1
0.132
aldob
-0.030
mocos
0.131
myo18ab
-0.030
FP236197.1
0.130
cthrc1a
-0.030
XLOC-030940
0.129
tnnt3b
-0.030
CDCP1
0.129
pcolce2b
-0.030
BX927300.1
0.128
pabpc1b
-0.030